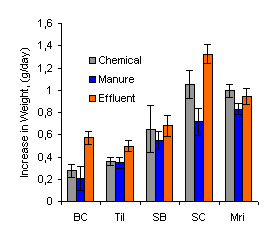
Figure 1. The daily weight gains of each fish species according to the different fertilizer treatment |
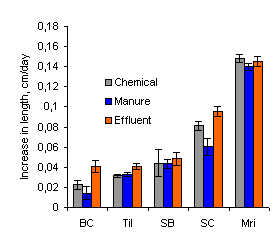 Figure 2. The daily increases in length of each fish species according to the different fertilizer treatments |
An experiment was conducted in
the Fish Farm at the
All of the five fish species
(Tilapia, Silver carp, Bighead carp, Silver barb and Mrigal) grew faster in ponds fertilized with effluent than
with manure, but the degree of response was highest for Silver Carp, Bighead
carp and Tilapia and least for Mrigal. The net fish
yield was
55% greater in ponds fertilized with biodigester
effluent rather than with fresh manure. The improvement with effluent compared
with chemical fertilizer was 27%.
Dissolved oxygen concentrations
were significantly increased when the ponds were fertilized with effluent
compared with fresh manure. Thus the principal benefit of prior anaerobic
digestion of pig manure appears to be the decrease in the BOD (biological oxygen
demand) in the effluent due to removal of carbon as methane in the digestion
process.
The recovery of nitrogen in the fish from the
nitrogen in the fertilizer was 42% for the biogester effluent, 26% for the manure and 37% for the
mixture of urea and di-ammonium
phosphate.
Poverty, population growth and environmental degradation
(air, soil and water pollution) are increasingly being considered as focal
points for research and development. The integration of livestock with trees,
food crops and aquaculture is seen as the most appropriate way to use the
natural resources in a system that is productive and sustainable (Preston 2000).
In such a system the processing of the livestock manure by anaerobic digestion
is a key component as it has many positive features such as reduction in
emission of methane (a major actor in global warming), decrease in pathogens
(better health of people and animals), production of biogas for cooking (reduced
pressure on forests for fuel wood; more comfortable working conditions in the
kitchen for women) and improved nutrient recycling (reduced need for chemical
fertilizer).
The main products from the biodigester are biogas and effluent. The latter has considerable potential as
fertilizer because the anaerobic digestion process results in conversion of
organic nitrogen in the manure to ionized ammonia (NH4+) which can be used directly by
plant roots. Despite the potential
for improved fertilizer capacity of effluent compared with raw manure there are
few reports of trials to compare the two sources of plant nutrients. In
The following experiment was carried out to obtain further
evidence concerning the apparently superior fertilizer value of biodigester effluent, compared with fresh manure, when used
in polyculture fish ponds.
The objective was to compare fresh pig manure with biodigester effluent, derived from the same manure, as the
source of nutrients in polyculture fish ponds.
Nine ponds with areas ranging from 45 to 65 m² and a depth of 1m were used. Three fertilizer treatments were applied to each of three ponds according to a random block design (Table 1). The treatments were:
|
Table 1:
Allocation of the treatments to the ponds | ||||||||
|
Block
1 |
Block
2 |
Block
3 | ||||||
|
PE |
U-DAP |
PM |
PM |
U-DAP |
PE |
PM |
PE |
U-DAP |
A plastic biodigester (Bui Xuan An et al 1997) was installed on
The biodigester was loaded initially with 392 kg of fresh pig manure. After a period of 19 days a further 100 kg were added and subsequently varying amounts were added at 2 to 3 day intervals, the aim being to achieve an average loading rate of about 15 kg fresh manure per day. At each loading water was added to the fresh manure to give a total solids content of about 10%.
All ponds were spread with
quick-lime (CaO) at 1 kg/10m², 10 days before stocking
with fish. This was to eliminate parasites and pathogenic organisms and to
increase the pH. The ponds were
filled with water 3 days after liming. Each pond was stocked with five fish
species at a density of 2 fish/m². The relative
proportions of the different species were: Tilapia (Oreochromis niloticus): 35%,
Silver carp (Hypophthalmichthys molitrix): 30%, Bighead carp (Aristichthys nobilis): 15%,
Silver barb (Puntius gonionotus):15% and Mrigal
(Cirrhinus mrigal): 5%. The Tilapia, Bighead carp, Silver carp and
Silver barb were available from the fish farm in the
The fertilizer treatments were applied 3 days after stocking the fish. The amounts of the inputs (U-DAP, PM and PE) were calculated to be iso-nitrogenous based on the nitrogen present in a loading rate for fresh pig manure of 15 g dry matter/m2. However, at this rate of application the fish in the ponds receiving the treatment receiving fresh pig manue gulped for air in the early morning. The total quantities (Table 2) were then adjusted on the basis of applying 6 g dry matter (as fresh pig manure)/m2 per day, given in amounts of 18 g every third day.
|
Table 2:
Total
quantities of fertilizer added to the ponds over a 152 day
period | |||||||||
|
Pond
No: |
1 |
2 |
3 |
4 |
5 |
6 |
7 |
8 |
9 |
|
Area,
m2 |
57 |
59 |
60 |
50.5 |
60.5 |
65 |
55 |
62.5 |
45 |
|
Fresh pig
manure, kg |
|
122 |
102 |
|
|
111 |
|
| |
|
Effluent,
litres |
2070 |
|
|
|
|
2356 |
|
2271 |
|
|
Urea,
kg |
|
1.3 |
|
|
1.37 |
|
|
|
1.02 |
|
DAP,
kg |
|
0.323 |
|
|
0.331 |
|
|
|
0.246 |
|
Total N,
kg |
0.704 |
0.672 |
0.753 |
0.634 |
0.690 |
0.80 |
0.692 |
0.781 |
0.513 |
|
N,
mg/
m2/day |
117 |
108 |
119 |
119 |
108 |
117 |
119 |
117 |
108 |
The weight and length of the fish were determined every 20
days in the morning at
Samples of fresh pig manure and the corresponding effluent were taken every 15 days and analysed for nitrogen and ammonia, using a Foss-Tecatur kjeldahl apparatus (AOAC 1990), and for dry matter by micro-wave radiation (Undersander et al 1993).
The oxygen level of the pond water was
measured one day a week, two times during the day in the early morning at
Water temperatures were measured five days a week, three
times a day in the morning at
Daily increases in weight and length of the fish were
determined by linear regression with days as the independent variable. The data
were analyzed by Analysis of Variance (ANOVA) using the General Linear Model
software of Minitab version 12.21, and the Tukey test
for checking differences among the treatment means. Variables were fertilizer treatments, fish species and
error.
The dry matter of
the pig manure, in samples taken at approximately two week intervals, varied in
the range 29.6 to 41.8% with corresponding contents of N of 1.65 to 1.86% in DM
(Table 3). The N content of the
effluent during the same period ranged from 290 to 470 mg N/litre. The ammonia-N in the effluent varied in the range 223
to 484 mg/litre.
The average amount of fresh pig manure added to the biodigester was
46±2.8 kg (excluding the initial charge of 392 kg) with an interval of 2 days.
This resulted in a mean daily load of 15 kg including the initial charge on day
1. Water was added at the rate of 2 volumes of water per volume of manure to
achieve a solids content of approximately 10%, thus the
average amount of diluted manure added daily to the biodigester was about 45 litres. The
liquid volume of the biodigester was estimated to be
4.0 m3 thus the average retention time would have been of the order
of 50 days.
|
Table 3: Levels of dry matter and nitrogen
in fresh pig manure added to the biodigester and
in the effluent removed from the biodigester for application to the ponds
| |||||
|
Date |
DM in manure, |
N in manure, |
N in manure, % in
DM |
N in effluent, mg/litre |
Ammonia-N |
|
May 10, 01 |
35.1 |
0.64 |
1.82 |
350 |
264 |
|
May 25, 01 |
29.6 |
0.51 |
1.75 |
290 |
318 |
|
June 10, 01 |
37.1 |
0.667 |
1.8 |
300 |
262 |
|
June 25, 01 |
36.0 |
0.669 |
1.86 |
400 |
478 |
|
July 10, 01 |
41.8 |
0.690 |
1.65 |
470 |
484 |
|
July 25, 01 |
32.3 |
0.590 |
1.82 |
300 |
223 |
|
August 10,
01 |
35.0 |
0.590 |
1.82 |
300 |
250 |
|
Mean |
35.2 |
0.622 |
1.79 |
344 |
326 |
|
SE |
1.45 |
0.0238 |
0.0262 |
26 |
42 |
Overall the fastest growth rates were with the effluent
fertilizer and the lowest with the fresh manure (Table 4 and Figures 1and 2).
There were differences in the response of the different fish species to the
fertilizer treatments. The Silver
Carp and the Bighead Carp in the effluent ponds had double the growth rate
compared with those in the manure ponds. Tilapia also grew faster in the
effluent than in the manure ponds but the difference was less marked. In
contrast, growth rates for Mrigal and Silver Barb were
similar in the effluent and manure ponds. Growth rates of fish in the ponds
fertilized with urea and diammonium phosphate (DAP)
tended to be intermediate between those in the manure and effluent ponds
|
Table
4: Least square means for rates of increase in weight and length of the
five fish species according to the fertilizer treatments |
|||||
|
|
Effluent |
Manure |
U-DAP |
SEM |
Prob. |
|
Weight gain, g/day |
|||||
|
Tilapia |
0.499 |
0.348 |
0.358 |
0.045 |
0.100 |
|
Silver
carp |
1.326 |
0.716 |
1.049 |
0.114 |
0.026 |
|
Bighead
carp |
0.572 |
0.207 |
0.276 |
0.078 |
0.035 |
|
Silver
barb |
0.682 |
0.551 |
0.651 |
0.133 |
0.517 |
|
Mrigal |
0.946 |
0.831 |
0.996 |
0.004 |
0.451 |
|
Increase
in length, mm/day |
|||||
|
Tilapia |
0.405 |
0.329 |
0.315 |
0.002 |
0.71 |
|
Silver
carp |
0.958 |
0.604 |
0.811 |
0.006 |
0.021 |
|
Bighead
carp |
0.407 |
0.144 |
0.224 |
0.005 |
0.037 |
|
Silver
barb |
0.483 |
0.433 |
0.441 |
0.009 |
0.630 |
|
Mrigal |
1.482 |
1.401 |
1.454 |
0.061 |
0.226 |

Figure 1. The daily weight gains of each fish species according to the different fertilizer treatment |
 Figure 2. The daily increases in length of each fish species according to the different fertilizer treatments |
|
Table
5: Least square means of weight and length of the five fish species
according to the fertilizer treatments |
|||||
|
Fish
species |
Effluent |
Manure |
U-DAP |
SEM |
Pro |
|
Weight,
g |
|
|
|
|
|
|
Tilapia |
48.6 |
39.3 |
41.5 |
0.625 |
0.001 |
|
Silver
carp |
84.4 |
57.2 |
70.3 |
1.18 |
0.001 |
|
Bighead
carp |
88.4 |
65.2 |
74.4 |
1.80 |
0.001 |
|
Silver
barb |
55.8 |
47.9 |
55.0 |
1.39 |
0.001 |
|
Mrigal |
45.1 |
39.7 |
47.6 |
1.66 |
0.007 |
|
Length,
cm |
|||||
|
Tilapia |
10.4 |
9.81 |
9.93 |
0.053 |
0.001 |
|
Silver
carp |
15.6 |
14.1 |
14.7 |
0.086 |
0.001 |
|
Bighead
carp |
16.0 |
14.6 |
15.2 |
0.129 |
0.001 |
|
Silver
barb |
11.5 |
11.3 |
11.5 |
0.090 |
0.219 |
|
Mrigal |
9.65 |
9.13 |
9.35 |
0.114 |
0.015 |
|
|
||||||
|
|
Initial
|
Final
|
||||
|
|
Effluent |
Manure |
U-DAP |
Effluent |
Manure |
U-DAP |
|
Weight,
g |
||||||
|
Tilapia |
16.5 ±
0.43 |
16.0 ±
0.39 |
15.9 ±
0.51 |
71.4 ±
1.76 |
56.4 ±
1.64 |
55.9 ±
1.92 |
|
Silver
carp |
15.0 ±
0.36 |
15.4 ±
0.24 |
15.5 ±
0.29 |
143 ±
4.46 |
95.8 ±
3.27 |
116 ±
3.88 |
|
Bighead
carp |
44.3 ±
2.57 |
45.9 ±
1.85 |
47.0 ±
3.29 |
107 ±
4.55 |
73.6 ±
4.69 |
86.9 ±
3.08 |
|
Silver
barb |
18.0 ±
0.42 |
17.8 ±
0.42 |
17.0 ±
0.45 |
83.3 ±
4.21 |
77.9 ±
3.89 |
82.3 ±
5.95 |
|
Mrigal |
0.73 ±
0.13 |
0.60 ±
0.00 |
0.67 ±
0.07 |
89.6 ±
10.41 |
78.8 ±
5.00 |
94.4 ±
6.36 |
|
Length,
cm |
||||||
|
Tilapia |
8.02 ±
0.11 |
7.75 ±
0.11 |
7.82 ±
0.16 |
12.2 ±
0.142 |
11.4 ±
0.11 |
11.3 ±
0.14 |
|
Silver
carp |
10.1 ±
0.15 |
10.5 ±
0.13 |
10.2 ±
0.12 |
19.3 ±
0.27 |
16.5 ±
0.25 |
17.9 ±
0.29 |
|
Bighead
carp |
13.3 ±
0.31 |
13.7 ±
0.19 |
13.4 ±
0.33 |
17.4 ±
0.27 |
15.1 ±
0.35 |
16.0 ±
0.25 |
|
Silver
barb |
8.78 ±
0.11 |
8.72 ±
0.12 |
8.40 ±
0.12 |
13.4 ±
0.25 |
13.1 ±
0.21 |
13.3 ±
0.40 |
|
Mrigal |
2.6 ±
0.25 |
2.56 ±
0.22 |
2.5 ±
0.21 |
16.6 ±
0.73 |
15.7 ±
0.38 |
16.2 ±
0.50 |
Tilapia grew faster in effluent and U-DAP ponds than in manure ponds (Table 5 and Figures 3 and 4). The mean weights at the end of experiment (Table 6) were 48.7, 39.3 and 41.5 g for the effluent, fresh pig manure and chemical fertilizer, respectively.
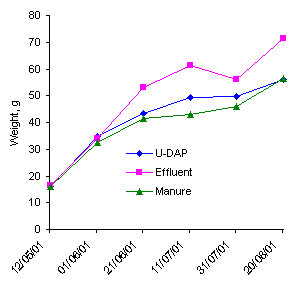 Figure 3: The growth in weight of Tilapia according to the different fertilizer treatments |
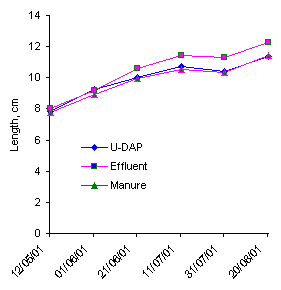
Figure 4: The growth in length of Tilapia according to the different fertilizer treatments |
Silver carp grew faster in effluent and U-DAP ponds than in
manure ponds (Table 5 and Figures 5 an 6). As with the
Tilapia, growth was faster in the first two months and slightly slower in the
third month, especially in the pig manure ponds. Compared with the other fish
species, Silver carp grew very fast in the effluent pond, which probably
reflected the ready availability of food for them, mostly as phytoplankton.
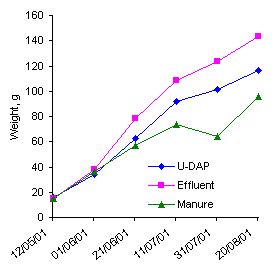
Figure 5: The growth in weight of Silver Carp according to the different fertilizer treatments |
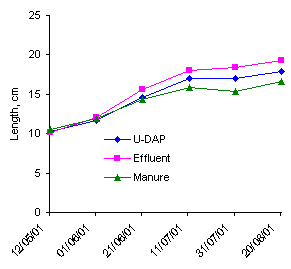
Figure 6: The growth in length of Silver Carp according to the different fertilizer treatments |
Bighead carp grew faster in effluent and U-DAP ponds than in the manure ponds (Table 4). The difference between effluent and manure ponds was especially noticeable (Figures 7 and 8). As with Tilapia and Silver Carp, growth rate decreased markedly after the second month.
|
|
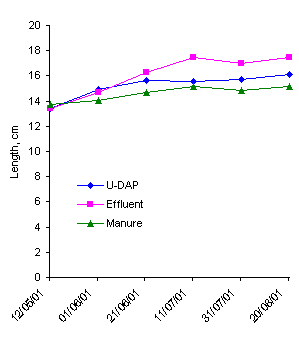 Figure 8: The growth in length of Bighead carp according to the different fertilizer treatments |
During the first two months, the Silver barb grew at the same
rate in the effluent and U-DAP ponds with slowest growth being observed in the
manure ponds (Table 4 and Figures 9 and 10). However, the final weights at the
end of the experiment (Table 6) showed no difference among the treatments.
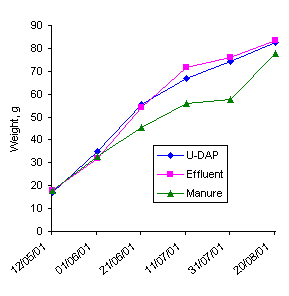
Figure 9: The growth in weight of Silver barb according to the different fertilizer treatments |
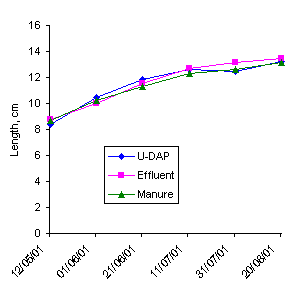
Figure 10: The growth in length of Silver barb according to the different fertilizer treatments |
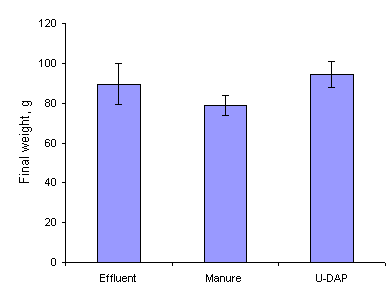
There were no differences in final weight between the fish in the effluent and U-DAP ponds but those in the manure ponds tended to be lighter. The difference was significant between DAP and the manure pond but not between effluent and manure ponds (Figure 11).
The fish yield extrapolated to a per
hectare basis was expressed as the net gain in total fish weight and the gross
output (Table 7; Figure 12). There were significant differences among
treatments, with highest values for the effluent treatment followed by chemical
fertilizer and the manure ponds. Compared with the manure treatment, the
chemical fertilizer increased net yield by 27% while the effluent treatment
increased it by 55%.
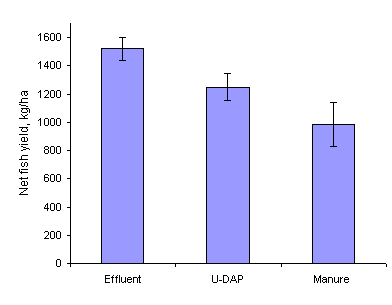
Figure 12: The net fish yield according to the different fertilizer treatments
|
Table 7. Mean values (with SEM)
for the fish yield according to the
different fertilizer treatments in the 100-day
experiment. | |||||
|
Variable |
Effluent |
Manure |
U-DAP |
SEM |
Probability |
|
Initial weight,
g/m2 |
39.3 ± 3.17 |
39.6 ± 1.38 |
39.7± 3.69 |
2.92 |
0.995 |
|
Final weight,
g/m2 |
191 ± 11.2 |
138± 10.4 |
164± 11.7 |
11.12 |
0.040 |
|
Weight gain,
g/m2 |
152 ± 8.20 |
98.4± 9.57 |
124± 15.4 |
11.50 |
0.045 |
|
Extrapolated net fish
yield, kg/ha |
1521± 82 |
984± 95.7 |
1248± 154 |
115 |
0.045 |
|
Extrapolated gross fish
yield, kg/ha |
1915 ± 112 |
1381± 104 |
1645± 117 |
111.23 |
0.040 |
The results from this study show that the productivity of the ponds was relatively low, if compared with the potential when pond inputs are optimized. According to Knud-Hansen et al (1991) and Lin et al (1997) the optimum inputs of nitrogen and phosphorus for fish culture are 4 kg N/ha/day and 1 kg P/ha/day or 400 mg N/m2 and 100 mg/m2 per day, respectively. The quantity of N recommended by these authors is almost 4 times higher than what was used in the present study (about 1 kg N/ha/day). In a report by Lin et al (1998), the growth rate of Tilapia was 0.24 and 0.30 g per day in earthen ponds loaded with 429 mg N/m2/day and 114 mg P/m2/day and with a stocking density of 10 and 5 fish/ m2, respectively. In contrast, in the present study, the N application was only 108 to119 mg N/m2/day and the growth rate of the Tilapia at a stocking density of 2 fish/ m2 was 0.35 g/day with manure increasing to 0.5 g/day with the effluent. Thus the growth rates of the Tilapia were higher in our study but stocking rates, and hence overall productivity, was much less.
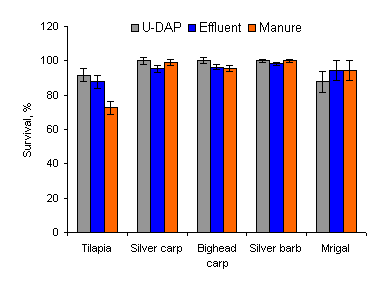
Overall the survival rates tended to be highest in the ponds
fertilized with urea and DAP (Table 8; Figure 13) but the difference was only
significant in the case of Tilapia that had poorer survival rates in the pond
fertilized with fresh manure as compared with the others.
|
Table
8: Least
square means for survival rates of the five fish species according to the
fertilizer treatments | |||||
|
|
Effluent |
Manure |
U-DAP |
SEM |
Prob. |
|
Tilapia |
87.7 |
72.7 |
91.7 |
3.93 |
0.032 |
|
Silver
carp |
95.3 |
99.0 |
100 |
1.98 |
0.289 |
|
Bighead
carp |
96.3 |
95.7 |
100 |
1.65 |
0.218 |
|
Silver
barb |
98.3 |
100 |
100 |
0.96 |
0.422 |
|
Mrigal |
94.3 |
94.3 |
87.7 |
5.86 |
0.668 |
|
Table 9.
Mean values of water quality
parameters during the experimental period according to the fertilizer
treatments | |||||
|
Parameters |
Effluent |
Manure |
U-DAP |
SEM |
Probability |
|
Dissolved oxygen, mg/litre | |||||
|
0600
hr |
2.11 |
1.19 |
1.92 |
0.090 |
0.001 |
|
1400
hr |
7.13 |
6.22 |
6.62 |
0.213 |
0.012 |
|
pH |
|
|
|
|
|
|
0900
hr |
7.79 |
7.76 |
7.81 |
0.032 |
0.538 |
|
1600
hr |
8.66 |
8.39 |
8.66 |
0.030 |
0.001 |
|
Temperature,
ºC |
32.0 |
32.1 |
32.0 |
0.132 |
0.880 |
|
Secchi disk
depth, cm |
19.4 |
24.1 |
21.1 |
0.515 |
0.001 |
The dissolved oxygen concentration, both in early morning and
afternoon, was lowest in ponds fertilized with fresh pig manure (Table 9).
Values for effluent and U-DAP ponds were similar with a tendency for higher
values in the effluent ponds. During most of the culture period, the oxygen
concentration was less than 1mg /litre in the morning
in ponds loaded with fresh pig manure (Figure 14). Differences were less marked
in the afternoon, but low values for dissolved oxygen were observed in manure
ponds midway through the culture period (Figure 15). According to Swingle (1969), the minimum oxygen concentration should be
not less than 5 mg/ litre. Values from 0.3 to
1mg/litre over an extended period were considered to be lethal to fish and from
1mg to 5mg/litre the fish will survive, but growth will
be slow. Thus it can be concluded
that biodigester effluent provides better conditions
for fish growth than fresh manure.
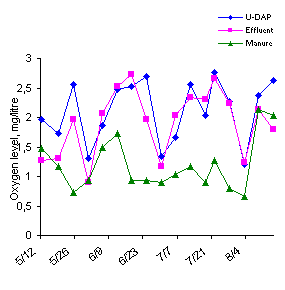 Figure 14: The fluctuation of oxygen level in the ponds at 06.00 hr, according to the different fertilizer treatments. |
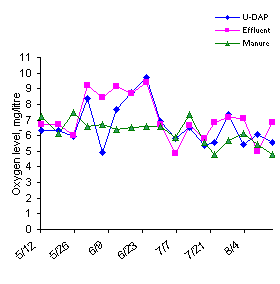
Figure 15: The fluctuation of oxygen level in the ponds at 14.00 hr, according to the different fertilizer treatments. |
The pH of the pond water in early morning did not differ
among the treatments. In the afternoon, pH was lower (P=0.001) in the manure
ponds than in those fertilized with effluent or U-DAP (Table 9). According to
Swingle (1969) the appropriate pH range for good fish
growth is from 6.5 to 9. The values recorded in the present study were within
this range for all treatments (Figures 16 and 17).
|
|
|
There were no differences among the treatments (Table 9; Figures 16 and 17).
The water transparency
differed among treatments with the lowest value for the effluent, followed by
thechemical fertilizer and fresh pig manure, respectively (
Figure 18)
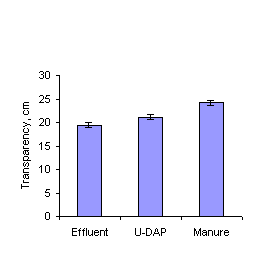
Figure
18: The mean values
of water transparency according to
the different fertilizer treatments
The most
important finding in the present study is the 55% increase in net fish yield as
a result of processing the pig manure through a biodigester. In
a comparison of fresh pig manure (FPM) and biogas fermentation liquid (BFL)
[presumably the liquid fraction of the biodigester
effluent], in a polyculture of seven species (Silver
carp, Bighead carp, Chinese bream, Grass carp, Black carp, Common carp and Crucian carp), the overall fish yield in the BFL ponds was
26.2% higher than in FPM ponds and all the species responded similarly, except
for the Bighead carp that grew at the same rate on both treatments (Han Yuqin and Ding Jieyi 1983). In
contrast, in the present study the Bighead carp grew faster in the effluent
ponds (0.57 g/day) than in those fertilized with fresh pig manure (0.28 g/day).
The Bighead carp feeds mainly on zooplankton and
the population of zooplankton in the pond is dependent on the presence of
phytoplankton (since zooplankton feeds on phytoplankton). Therefore, if the
phytoplankton grows well, zooplankton grows well also. Thus it is to be expected
that Bighead carp will grow faster in ponds loaded with effluent than in those
loaded with fresh pig manure.
The efficiency with
which nutrients are recycled in the farming system is an important indicator of
sustainability. In the present study, estimates were made of the proportion of
the applied fertilizer nitrogen that was recovered in the fish
biomass (Table 10). For the estimation of the nitrogen content of the fish it was
assumed that 20% of the live weight was protein and that 16% of the protein was
in the form of nitrogen.
|
Table 10: Efficiency of utilization of nitrogen in the
three fertilizer systems | |||
|
|
Effluent |
Manure |
U-DAP |
|
N balance,
kg/ha |
|
|
|
|
Input in
fertilizer |
117 |
119 |
108 |
|
Net gain in
fish |
48 |
31 |
40 |
|
N recovery, % |
42 |
26 |
37 |
|
N
recovery = (N gain - N input)*100 | |||
The rate of
recovery of the nitrogen was highest for the effluent and lowest for the fresh
pig manure. In other words,
processing the pig manure through the biodigester
increased the rate of utilization of the nitrogen for fish growth by 62%. The only comparable data are from the
study of Kean Sophea and
Processing pig manure in an anaerobic
biodigester, before using it as fertilizer for ponds
stocked with a fish polyculture, resulted in a
55% increase in net fish growth compared with direct application of the fresh
manure.
Compared with the
use of iso-nitrogenous amounts of a mixture of urea and
di-ammonium phosphate, the net fish yield was
increased by 27% in the ponds fertilized with biodigester effluent.
All of the five
fish species (Tilapia, Silver carp, Bighead carp, Silver barb and Mrigal) grew faster in ponds fertilized with effluent than
with manure, but the degree of response was highest for Silver Carp, Bighead
carp and Tilapia and least for Mrigal.
Dissolved oxygen
concentrations were significantly increased when the ponds were fertilized with
effluent compared with fresh manure. Thus the principal benefit of prior
anaerobic digestion of pig manure appears to be the decrease in the BOD
(biological oxygen demand) in the effluent due to removal of carbon as methane
in the digestion process.
The recovery of
nitrogen in the fish from the nitrogen in the fertilizer was 42% for the biogester effluent, 26% for the fresh manure and 37% for the
mixture of urea and di-ammonium phosphate.
We wish to acknowledge the assistance of of our colleagues Mr Chhaty for carrying out the laboratory analyses, Mr San Thy for help in installing the biodigester and Lylian Rodriguez and Dr Julio Ly for fruitful discussions during the conduct of the experiment.
Bui Xuan An,
Ding Jieyi and Han Yujin 1984
Comparative studies on the effects of
fresh pig manure and anaerobically fermented pig
manure upon fish farming, p: 288-296.
Knud-Hansen C F,
McNabb C D and Bartterson T R 1991 Application
of limnology for efficient nutrient utilization in tropic pond aquaculture.
Verh. Internat. Verein Limnol.,
24:2,541-2.543.
Le Ha Chau
1998a Biodigester effluent versus manure from pigs or cattle as
fertilizer for production of cassava foliage (Manihot
esculenta). Livestock Research for Rural Development (10)
3: http://cipav.org.co/lrrd/lrrd10/3/chau1.htm
Le Ha Chau 1998b
Biodigester effluent versus manure, from pigs or
cattle, as fertilizer for duckweed (Lemna spp.). Livestock Research for Rural Development (10)
3: http://cipav.org.co/lrrd/lrrd10/3/chau2.htm
Lin C K, Teichert-Coddington D
R, Green BW and Veverica K L 1997 Fertilization regimes. In: H.S. Egna and K.L. Boyd (Editors), Dynamic of pond aquaculture.
CRCP Press,
Lin C K, Yang Yi, Shivappa R B
and Kabir Chowhury M A
1998 Optimization of Nitrogen
Fertilization Rate in Freshwater Tilapia Production Ponds. PD/A CRSP Sixteenth Annual Technical
Report, P: 49-56
Swingle H S
1969 Methods of analysis for waters,
organic matter and pond bottom soils used in fisheries research.
Undersander D, Mertens D R
and Thiex N 1993 Forage analysis procedures. pp 154 National Forage Testing
Association.