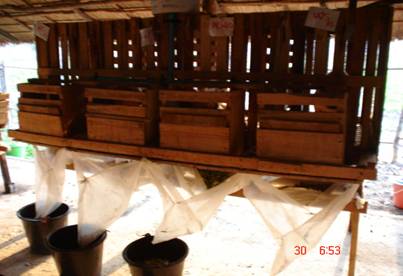
Photo 1: Metabolism cage made from wood for digestibility and N retention studies
|
Matching Livestock Systems with Available Resources |
MEKARN Regional Conference 2007 |
Four crossbred (Mong Cai*Large
White) castrated male pigs of 8.0 to 10.0 kg were used to study the effect of
different levels of water spinach inclusion (10, 20, 30 and 40%) in a basal
diet of cassava root meal and rice bran on the intake, nutrient digestibility
and N balance. Total dry matter (DM)
intake and feed intake as percentage of body weight decreased with increasing
levels of water spinach (P<0.001) and nutrient digestibility and N balance
increased with increasing levels of water spinach in the diet.
It was concluded that nutrient digestibility and N balance were improved when water spinach was included at levels of up to 40% in diets of growing pigs.
Introduction
Materials and methods
Location and duration
The experiment was conducted at the Livestock Research Center of the National Agriculture and Forestry Institute (NAFRI), Namxuang, about 44 km from Vientiane City, Lao PDR, from 28 February to 7 April 2005.
Treatments and design
There were four treatments:
· WS10: Water spinach 10% and rice bran 90%
· WS20: Water spinach 20%, rice bran 70% and cassava root meal 10%
· WS30: Water spinach 30%, rice bran 50% and cassava root meal 20%
· WS40: Water spinach 40%, rice bran 30% cassava root meal 30%
The experimental design was a Latin square 4*4 arrangement with 4 pigs and 4 periods.
|
Table 1: Layout of the experiment |
||||
|
Period/pig |
Pig 1 |
Pig 2 |
Pig 3 |
Pig 4 |
|
1 |
WS10 |
WS20 |
WS30 |
WS40 |
|
2 |
WS40 |
WS10 |
WS20 |
WS30 |
|
3 |
WS30 |
WS40 |
WS10 |
WS20 |
|
4 |
WS20 |
WS30 |
WS40 |
WS10 |
Animals and housing
Four crossbred (Mong Cai*Large White) castrate pigs with live weight from 8.0 to 10.0 kg were used in the experiment. The pigs were housed in wooden metabolism cages that allow the separate collection of urine and faeces (Photo1). The size of the metabolism cages was 0.8m x 0.8m (Bounghong et al 2004). The experimental periods were each of 12 days: 7 days for adaptation to allow the pigs to become familiarized with the new diet and a five-day period for collection of faeces and urine.
Photo 1:
Metabolism cage made from wood for digestibility and N retention studies
Feeds and feeding system
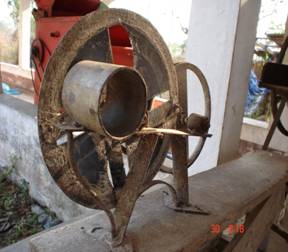
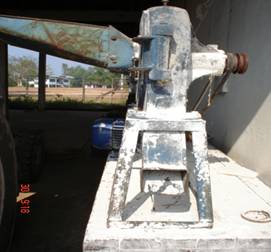
The pigs were fed the diets shown in table 2. The cassava roots were harvested from plots at the Livestock Research Center, and after harvesting were chopped by machine (Picture 2) and dried for 3-4 days until completely dry. Water spinach was purchased in the first 2 months and then later on was harvested in the center. Rice bran was purchased from a rice mill near the center.
|
Table 2: Diet composition, % of DM |
||||
|
Ingredients |
WS10 |
WS20 |
WS30 |
WS40 |
|
Rice bran |
90 |
70 |
50 |
30 |
|
Cassava root meal |
0 |
10 |
20 |
30 |
|
Water spinach |
10 |
20 |
30 |
40 |
|
CP in DM, % |
9.76 |
11.0 |
12.2 |
13.4 |
|
|
|
|
Photo 2: Machine for chopping cassava roots Photo 3: Machine for grinding cassava roots |
|
Measurements
Urine and faeces of each pig were collected separately and weighed daily every morning and stored at -20 0C. Urine was collected in a bucket via a plastic sheet and funnel placed below the cage. To prevent nitrogen losses by evaporation of ammonia, the pH was kept below pH 4 by putting 10ml of 10% sulphuric acid in the urine. The urine and faeces from each animal were collected for five days and at the end of the period the faeces were mixed, ground and representative samples taken for analysis. Dry matter of feed offered, refused and faeces was done by microwave radiation (Undersander et al 1993). Nitrogen in faeces, urine, feeds offered and refused were determined according to the Kjeldahl method (AOAC 1990).
Statistical analysis
The data were analysed using the GLM option of the Minitab (version 13.31) ANOVA software. Sources of variation were feed, periods, pigs and error.
Results and discussion
Feed characteristics
|
Table 3: Chemical composition of the dietary ingredients |
|||
|
|
Water spinach |
Cassava root meal |
Rice bran |
|
Dry matter |
7.48 |
87.7 |
87.4 |
|
Nitrogen |
4.00 |
0.54 |
1.29 |
|
Crude protein |
25.0 |
3.37 |
8.06 |
Feed intake
The diets with 10 and 20% water spinach were completely consumed. Total voluntary feed intake decreased with increasing level of water spinach (Table 4). The dry matter intake as percent of body weight was highest for WS20, followed by WS10.
|
Table 4: Effect of diet on intakes of dry matter, water spinach, cassava root meal and rice bran |
||||||
|
|
WS10 |
WS20 |
WS30 |
WS40 |
SEM |
Prob. |
|
Intake, g DM/day |
|
|
|
|
||
|
Water spinach |
60.2 |
116 |
161 |
201 |
5.77 |
0.001 |
|
Rice bran |
528 |
399 |
251 |
173 |
12.9 |
0.001 |
|
Cassava root meal |
0 |
57 |
101 |
173 |
5.45 |
0.001 |
|
Total DM |
588 |
572 |
512 |
547 |
12.8 |
0.001 |
|
DM, % of BW |
5.05 |
5.23 |
4.58 |
4.94 |
0.11 |
0.002 |
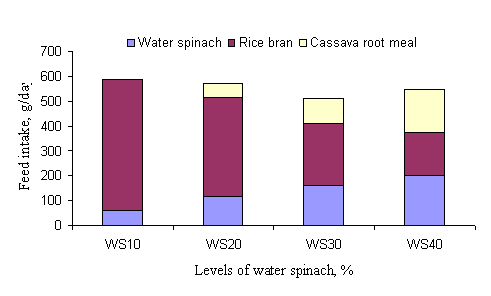
Figure 1:
Daily intake of dry matter, water spinach, cassava root meal and rice bran
Faecal characteristics in pigs fed water spinach, cassava root meal and rice bran
The dry matter content of the faeces decreased when the pigs were the diets with high levels of water spinach (Table 5).
|
Table 5: Faecal characteristics in pigs fed diets containing water spinach, cassava root meal and rice bran |
||||||
|
|
WS10 |
WS20 |
WS30 |
WS40 |
SEM |
Prob. |
|
DM, % |
39.1 |
35.9 |
32.9 |
31.6 |
0.55 |
0.001 |
|
Faecal excretion, g/day |
||||||
|
Fresh material |
442 |
367 |
290 |
283 |
27.2 |
0.001 |
|
Dry matter |
169 |
131 |
93.1 |
93.8 |
9.72 |
0.001 |
|
Water |
273 |
236 |
197 |
189 |
17.8 |
0.005 |
Digestibility coefficients
Dry matter and N digestibility increased with increasing level of water spinach (Table 6 and figure 2).
|
Table 6: Digestibility coefficients in pigs of diets containing water spinach, cassava root meal and rice bran |
||||||
|
|
WS10 |
WS20 |
WS30 |
WS40 |
SEM |
Prob. |
|
DM |
71.9 |
76.7 |
79.4 |
83.0 |
1.56 |
0.001 |
|
N |
72.1 |
73.0 |
77.9 |
80.6 |
1.79 |
0.001 |
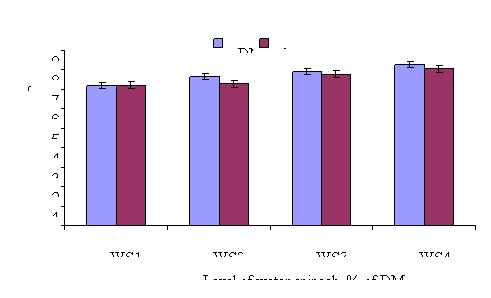
Figure 2: Dry matter and Nitrogen digestibility (%) of diets containing different levels of water spinach, cassava root meal and rice bran
Nitrogen retention
Daily N retention increased with level of water spinach (Table 7) in the diet and there was a very close relationship between the level of water spinach and N retention (Figure 3).
|
Table 7: Nitrogen retention in pigs fed diets with water spinach, cassava root meal and rice bran |
||||||
|
|
WS10 |
WS20 |
WS30 |
WS40 |
SEM |
Prob. |
|
N balance, g/day |
|
|
|
|
|
|
|
Intake |
9.13 |
10.5 |
10.9 |
12.3 |
0.29 |
0.001 |
|
Digested |
6.57 |
7.81 |
8.77 |
9.98 |
0.38 |
0.001 |
|
Retained |
4.31 |
5.36 |
6.76 |
8.00 |
0.46 |
0.001 |
|
Retention as % of |
|
|
|
|
|
|
|
Intake |
45.2 |
49.7 |
59.2 |
64.6 |
3.35 |
0.001 |
|
Digested |
61.1 |
67.9 |
74.3 |
79.5 |
3.90 |
0.009 |

Figure 3:
N retention increases with levels of water spinach
Conclusions
Nutrient digestibility and N balance were improved when the level of water spinach in diets of pigs was increased.
Acknowledgements
The authors would like to thank SIDA-SAREC for funding this
experiment through the MEKARN regional project, and staff of the Livestock
Research Center, NAFRI, for their cooperation.
References
AOAC 1990: Official methods of analysis. Association of Official Analytical Chemists, Arlington, Virginia, 15th edition, 1298 pp.
Undersander D, Mertens D R and Theix N 1993: Forage analysis procedures. National Forage Testing Association. Omaha pp 154.