|
|
|
Figure 1: Variation in global air temperature since the end of the 19th century (Source: NASA Goddard Institute for Space Studies Surface Temperature Analysis at data.giss.nasa.gov/gistemp/) |
|
Live stock production, climate change and resource depletion |
Responding to the challenges posed by global warming and the declining availability of most of non-renewable resources will require a paradigm shift in the practice of agriculture and in the role of live stock within the farming system. Farming systems should aim at maximizing plant biomass production from locally available diversified resources, processing of the biomass on farm to provide food, feed and energy and recycling of all waste materials.
The approach that is the subject of this paper is that the production of food/feed can be combined with the generation of electricity, thus ensuring sovereignty in food and energy for families in rural areas. The concept that facilitates this approach is the fractionation of biomass into edible (for food-feed) and inedible cell wall material, the latter being converted into a combustible gas by gasification, the gas in turn being the source of fuel for internal combustion engines driving electrical generators. The cell contents and related structures are sources of digestible carbohydrates, oil and protein which are used as human food and/or animal feed. An important byproduct from this process is “biochar” (65% carbon- 35% ash) that is both a sink for carbon, as well as a valuable amendment for the typically acid soils in tropical latitudes. The overall balance of these activities results in a farming system in which the carbon footprint is negative.
The appropriate production and utilization of biochar is in integrated farming systems that ensure food and fuel sovereignty without conflict. The principles are: (i) multi-strata cropping in systems which maximize capture of solar energy and provide substrates for production of food and fuel; (ii) a live stock component which facilitates recycling of high moisture organic waste through biodigesters to produce fertilizer and cooking gas; (iii) gasifiers to produce a combustible gas and biochar; and (iv) feed-in tariffs (FIT) for electricity derived from renewable resources.
In the TOSOLY ecological farm in Colombia on 4 ha (sugar cane 2 ha, forage trees1 ha, New Cocoyam [Xanthosoma sagittifolium] 1 ha, with average population of 60 pigs and 40 goats), the substrates for energy are: 24 tonnes dry bagasse, 12 tonnes dry forage tree stems, 3650 m3 biogas from 30 m3 of tubular polyethylene biodigesters and 2920 Kwh form solar voltaic panels (capacity 1.2 KW). The annual energy production is 37920 KWh (2920 solar electricity, 5500 biogas, 20000 producer gas) with an estimated EROEI >7. Energy demand is 7000 KWh (living quarters 3650, machinery 1850, electric van 1500). Annual surplus is 3920 KWh, which to replace grid electricity (USD 0.20/KWh) would give an income of USD 8 000. The annual ecological balance is: 3.6 tonnes of biochar equivalent to 8.4 tonnes of carbon dioxide sequestered, 1095 m3 liquid biodigester effluent (548 kg organic N), 1000 m3 of rain water harvested from roof tops, a negative carbon foot print and food produced organically.
Lessons learned are the need for rural-based support systems for construction and maintenance of equipment producing renewable energy, and advantages of small scale production systems, which facilitate animal traction and efficient recycling of wastes. Future strategies should include national rebalancing of payments/taxes to compensate rural areas that produce food and energy from renewable resources (eg: by feed-in-tariff for electricity) for consumption in the cities.
Energy is as important as food for supporting the present world population, and increased supplies of both will be needed to support the predicted 50% increase in global population by the year 2050. In fact the so-called “green revolution” that averted famine in much of SE Asia in the 60’s was an energy revolution as it was the inputs derived from fossil fuels that made possible the increased yields of cereal grain from the new genetically modified cereal varieties. The question to be debated is: what kind of energy will support future civilizations? Sources of energy are conveniently characterized as good (meaning renewable) or bad (eg: fossil fuels the burning of whch is the major cause of global warming). However, before making decisions as to which sources of energy are least harmful, and therefore merit being promoted, a discussion of present theories of the cause of global warming is relevant.
The close to 1°C increase in the air temperature since the beginning of the industrial revolution at the end of the 19th century is indisputable (Figure 1).
|
|
|
Figure 1: Variation in global air temperature since the end of the 19th century (Source: NASA Goddard Institute for Space Studies Surface Temperature Analysis at data.giss.nasa.gov/gistemp/) |
It is equally certain that it was the burning of fossil fuels, first of coal and later of oil, which made possible the industrial revolution and the resultant increase in air temperature. It also led to a massive increase in the world population (Figure 2) as cheap energy nurtured cheap food production.
|
|
|
Figure 2. Energy and population growth (from Campbell 2000)) |
The explanation of global warming is usually attributed to the “greenhouse” effect caused by accumulation of gases in the atmosphere preventing the outward radiation of heat derived initially from the sun (Figure 3), and that most of these gases (mainly carbon dioxide, methane and oxides of nitrogen) arise from the burning of fossil fuels.
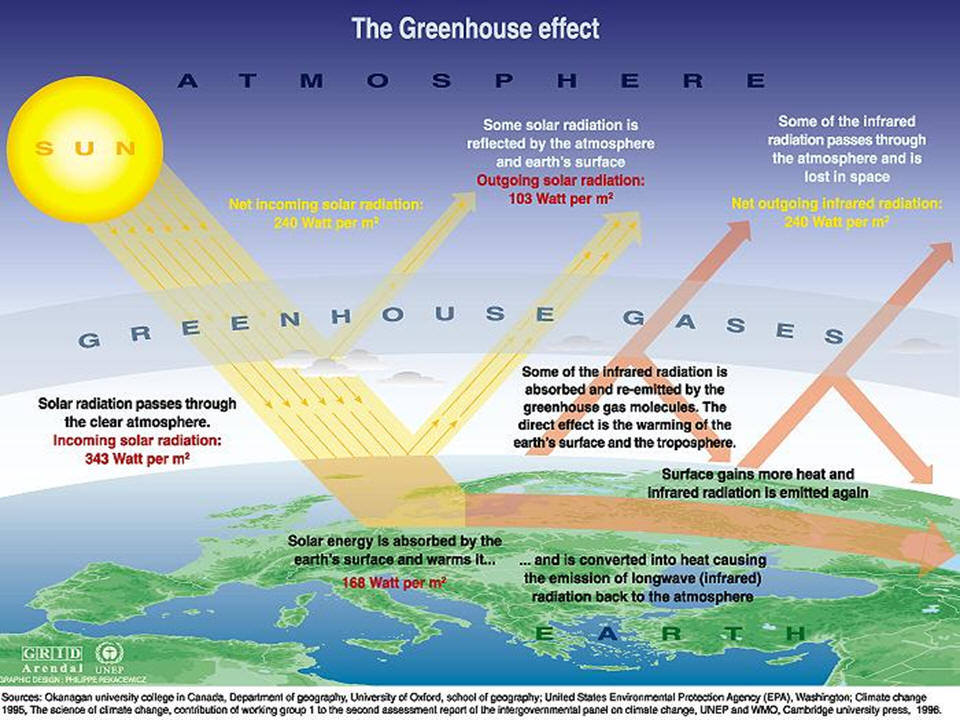 |
| Figure 3. The Greenhouse effect and global warmimg |
The view that greenhouse gases are the principal cause of global warming has been challenged by several scientists. The most detailed analysis of possible causes of global warming was made by a group of Swedish scientists (Nordell 2003; Gervet 2007; Nordell and Gervet 2009). The basis of their argument is the 1st Law of Thermodynamics that " Energy cannot be created nor destroyed" and the 2nd Law that '" all transformations of energy are accompanied by production of heat". They calculated the quantities of heat that have accumulated in the period 1990-2000) due to human activities (Figures 4 and 5) and showed that these accounted for 74% of the total heat production. They considered that only the missing 26% could probably b be ascribed to the greenhouse effect.
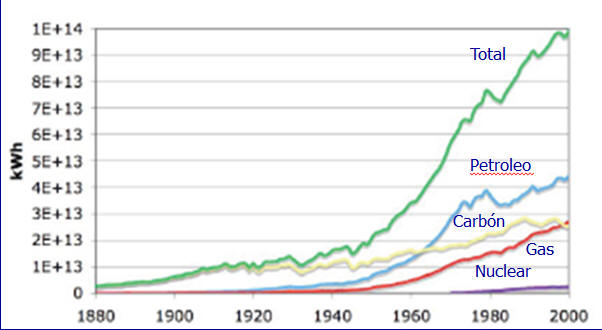 |
| Figure 4. Annual world energy consumption of non-renewable commercial energy (from Gervet 2007) |
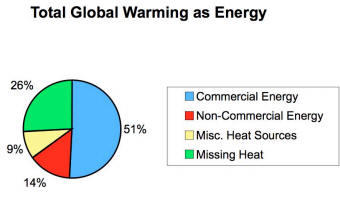 |
| Figure 5. Sources of heat produced by anthropogenic activities since the start of the industrial revolution (Gervet 2007) |
A similar conclusion was reached by Nickolaenko (2007) who calculated that anthropogenic heating (ie: heat resulting from human activities) could cause a 1°C rise in temperature in the space of a century (Box 1). .
|
du |
|
Box 1. Global warming and anthropogenic heating |
If it is agreed that the survival of planet earth requires that there should be neither an increase in greenhouse gas emissions nor in anthropogenic heat production, then hard decisions must be taken about future sources of energy. It's clear that the choices are limited to energy derived directly or indirectly from solar energy (Table 1).
|
Table 1. Effect of source of energy on net heat production and greenhouse gas emissions |
||
|
Source of energy |
Impact on heat production |
Impact on GHG emissions |
| Non-renewable | ||
|
Fossil fuels |
+++ |
+++ |
|
Nuclear transformations |
+++ |
=== |
|
Geothermal |
+++ |
=== |
|
Renewable |
|
|
|
Wind |
=== |
=== |
|
Waves and tides |
=== |
=== |
|
Photo-voltaic |
=== |
=== |
|
Direct solar heat capture |
=== |
=== |
|
Biomass |
=== |
--- |
| +++ Net increase; === neutral; --- Net decrease | ||
The need to change the way that energy is generated was emphasized by Chaisson (2008) who predicted that "the unavoidable global heating from the burning of non-renewable energy sources and harnessing of nuclear and geothermal power could raise global temperatures by up to 3°C within 300 years".
It is not a question of which activity should have priority. Both are needed. The point at issue is that the source of the biomass should be such that will facilitate the production of both food and energy. Certainly it is not acceptable, nor is it necessary, to convert potential food sources into fuel as are the current strategies underlying the production of ethanol (from starch and sugar) and biodiesel (from edible plant oils). Energy (from biomass) must be derived only from the fibrous residues after extraction of the food/feed component. Many crops lend themselves to fractionation of the food and energy components (eg: most cereal and tree crops as well as sugar cane).
The next issue to be faced is the choice of technology for deriving energy from fibrous crop residues. Procedures to convert cellulose-rich substrates to ethanolare unlikely to be economically viable (Patzek 20--) because of the need for mechanical, heat and chemical energy to convert the cellulose and hemicellulose components to fermentable C-6 and C-5 sugars. A related issue is the increasing understanding that liquid fuels from biomass must be of the "drop-in" variety, so that they are directly miscible with, and hence able to replace, current liquid fuels used for both terrestrial and aerial transport.
The most advanced cellulosic ethanol facility appears to be the one owned by the Iogen Company in Canada which is producing ethanol from wheat straw. On the basis of press reports from the company, and data on ethanol fermentation rates of C6 and C5 sugars (Badger 2005), Patzek (2007) derived the following table (Table 2).
|
Table 2. Comparison of the economics of producing ethanol from maize (established technology) with initial estimates of producing it from wheat straw (Source: Patzek 2007) |
|||
|
|
Maize-ethanol |
Cellulosic ethanol |
Units |
|
Capital costs |
$1.25-1.50 |
$4.30-5.50 |
Per US gallon |
|
Ethanol yield |
98 |
70-80 |
Gallons/tonne |
|
Conversion process |
Simple |
Complex |
|
|
Enzyme cost |
$0.03 |
$0.30 |
Per gallon |
|
Alcohol content |
14-20% |
4% |
|
|
Transport and preparation |
Low |
High |
Cost |
The steps in the process are: (i) fine milling, (ii) addition of water (8 to 9 times the weight of biomass) and application of heat in the presence of sulphuric acid or sodium hydroxide to separate the lignin from the cellulose and hemicelluloses; (iii) addition of synthetic enzymes to hydrolyse the cellulose to glucose and the hemicelluloses to pentoses (the latter are not fermented by natural yeasts, and genetically modified yeasts [Ho et al 1999] and/or synthetic enzymes have to be used; (iv) finally in the distillation stage (Figure 6), more water has to be removed, which requires more energy per unit of ethanol produced. In contrast with the fermentation of glucose [eg: from maize] the fermentation for cellulosic ethanol takes much longer [120-170 hours compared with 48-72 hours for maize], and the maximum concentration of ethanol does not exceed 4 to 5% (Badger 2005) compared with the range of 14 to 20% that can be achieved from maize) (Patzek 2007).
|
|
|
Figure 6. Fermentation limits and energy required for distillation for cellulosic ethanol compared with ethanol from maize (from Patzek 2007) |
The data in Table 3 indicate an overall conversion of straw DM to ethanol of 0.178. By comparison the conversion of maize grain DM to ethanol is 0.32 (kg ethanol/kg feedstock).
|
Table 3. Conversion of straw biomass to ethanol (from Badger 2002) |
||
|
Biomass, kg |
Ethanol, kg |
|
|
Straw |
1 |
0.178 |
|
Cellulose |
0.38 |
0.111 |
|
Hemicellulose |
0.29 |
0.067 |
|
Assumes enzyme conversion efficiency of 0.76 for cellulose to C6 sugars and 0.90 for hemicellulose to C5 sugars; stoichiometric conversion of sugars to ethanol is 0.51 |
||
It is fairly clear from the limited information available that the cellulosic feed stock would have to be procured and transported at a very low price for the system to be profitable. Without subsidies there is little chance that the process would be profitable. Other factors must also be taken into account. It is proposed (IEA 2010b) that the minimum capacity for a viable biomass refinery is of the order of 60,000 tonnes of dry biomass processed annually. The financial and energy cost of procuring low density biomass, processing it (into pellets or briquettes), and transporting it to a centralized refinery will be considerable. The social and environmental costs associated with such an operation will be yet another constraint.
Rapier (2009) describes many of these “second generation” proposals as Renewable Fuel Pretenders arguing that their proponents believe they have a solution but that it will never develop into a feasible technology because the proponents “have no experience at scaling-up technologies”. In this category he lists cellulosic ethanol, hydrogen and diesel oil from algae. Unfortunately, this author, like so many other advocates (and critics) of bio-fuels have their mind-set constrained by the very same features that facilitated the industrial revolution of the past two centuries, namely economies of scale and urbanization. Thus “scaling-up” is seen to be a “sine qua non” of any operation to produce bio-fuels. By contrast, it is argued that, in a fossil fuel-constrained world, utilization of biomass for integrated food and energy will be favored by small rather than large scale of operation.
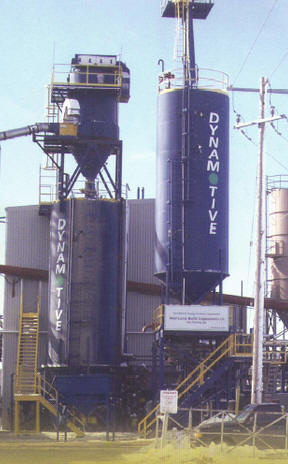
Pyrolysis is thermal decomposition occurring in the absence, or in a limited supply, of oxygen. It is the first step in combustion and gasification but in these processes it is followed by total or partial oxidation of the primary products. Table 4 indicates the product distribution obtained from different modes of pyrolysis.
| Table 4. Product yield from pyrolysis (or gasification) of wood (expressed as yield in terms of % dry weight conversion to products) (from IEA Bioenergy 2009) |
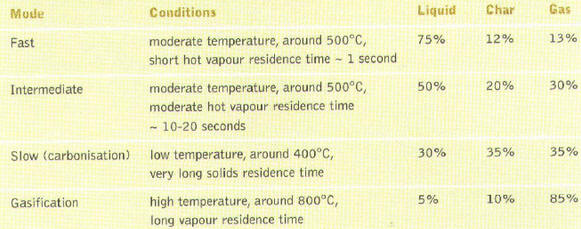 |
Fast pyrolysis for liquids production is currently of particular interest because liquids can be stored and transported more easily and at lower cost than solid biomass. The fast pyrolysis process includes drying the feed to typically less than 10% moisture, grinding the feed to around 2mm particle size, the pyrolysis process per se, separation of solids (char) and quenching and collection of the liquid product”. The gas and char produced in the pyrolysis process is used as the source of process heat (from IEA Bioenergy 200-).
 |
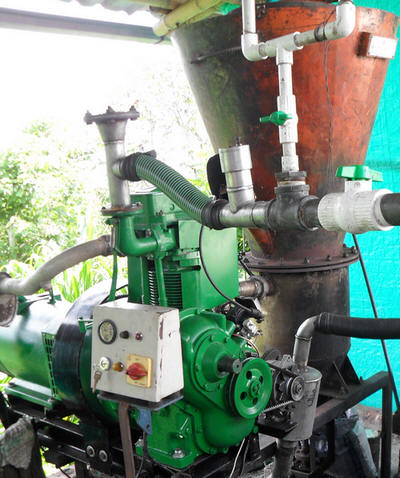 |
| Photo 1. The bio-refinery based on pyrolysis of fibrous biomass (Image: IEA Bioenergy) | Photo 2. Small scale gasifier, IC gas engine and electrical generator (Lylian Rodriguez) |
Based on the available information it can be concluded that:
The fast pyrolysis process for deriving energy from biomass is still in the development stage, at least as concerns the final processing of the bio-oil;
It is not a process that can be done on small scale farms
The process of deriving energy from fibrous biomass by gasification has been known since the end of the 19th century and was extensively used during the Second World War to power cars and trucks in Sweden, Denmark and Germany – countries with little national oil production. The author of this paper report was taught gasification in secondary school in the decade of the ‘40’s. Practical classes in the laboratory were done using gas derived from the gasification of coal. Gasification is still the method to produce coke for smelting iron ore.
Gasification is a process for deriving a combustible gas by burning fibrous biomass in a restricted current of air (Figure 7).. The process is a combination of partial oxidation of the biomass with the production of carbon which at a high temperature (600-800 °C) acts as a reducing agent to break down water and carbon dioxide (from the air) to hydrogen and carbon monoxide, both of which are combustible gases (Figure 8).
|
|
|
|
Figure 7. Principles of biomass gasification |
Figure 8. Chemical reactions in the gasifier |
The advantages of gasification are that; (i) the energy used to drive the process is derived from the combustion of the feedstock; (ii) there is minimal input of fossil fuel (mainly the embedded cost for the construction of the gasifier and associated machinery); and (iii) the process can be applied at any scale of operation, typically from 4 to 350 KVA. In contrast to the proposed processes for deriving liquid fuels from biomass, the input-output relationships for conversion of fibrous biomass to combustible producer gas (or wood gas) are documented (Table 5).
|
Table 5: Mean values for gasifier characteristics using coconut shells-husks, cassava stems, mulberry stems and branches of Cassia stamea as feedstock (from Miech Phalla and Preston 2005) |
||||||
|
|
Cassia |
Cassava |
Mulberry |
Coconut |
SEM |
Prob. |
|
Biomass, kg |
||||||
|
Initial |
36.7 |
32.3 |
33.7 |
34.4 |
1.3 |
0.21 |
|
Final |
4.93 |
1.9 |
0 |
3.07 |
2.19 |
0.49 |
|
Consumption |
36.9 |
35.1 |
40 |
36.4 |
2.9 |
0.69 |
|
Moisture, % |
14 |
13.3 |
15.7 |
14 |
1.4 |
0.69 |
|
Density, g/litre |
348 |
97.0 |
273 |
128 |
10.4 |
0.001 |
|
Duration, h |
3.91 |
3.67 |
4.09 |
4.02 |
0.328 |
0.81 |
|
Output, kwh |
27.4 |
25.7 |
28.7 |
28.2 |
2.29 |
0.81 |
|
Conversion# |
1.23 |
1.18 |
1.18 |
1.11 |
0.044 |
0.42 |
|
Efficiency## |
0.187 |
0.204 |
0.204 |
0.217 |
0.0082 |
0.17 |
|
Biochar, g/kg biomass DM |
109 |
128 |
109 |
137 |
16.5 |
0.58 |
|
# kg dry biomass/kwh; ## Assumes 15 MJ/kg biomass DM and 3.6 MJ/kwh of electricity |
||||||
Living in cities requires much more energy (personal transport, supply of food and other needs, dealing with waste) than living in rural areas (reference). City dwellers will also be at greater risk to the consequences of climate change (eg: flooding, extremes of temperature). The opportunity of the city dweller to produce food and energy from solar resources is also much less than for those living in rural areas Reversing the present trend of migration to cities will be facilitated when both food and energy become more expensive as measures are put in place to reduce global warming. An added incentive will be the need to increase production of food and energy which will create opportunities for employment and income generation in in rural areas.
In contrast to the trends promoted by easy access to cheap energy - specialization, intensification and economy of scale - future farming systems will respond to Schumacher's advocacy "that Small is Beautiful". The reasons why small scale farms will have comparative advantages are: because they
The strategy is to produce food and energy for family consumption and for sale, deriving both from direct and indirect use of solar energy in a live stock-based integrated farming system. The cropping system is based on sugar cane (feed for pigs, food and energy), coffee and cocoa (food and energy), forage trees (feed for goats and energy), trees for construction, shade, protection of the water resource and energy. The farm is situated in the Colombia foothills, in the Department “Santander Sur”, 250 km from the capital city of Bogotá. The region is characterized by relatively uniform rainfall (Figure 9) and soils that are acidic (pH 4.0-4.50).
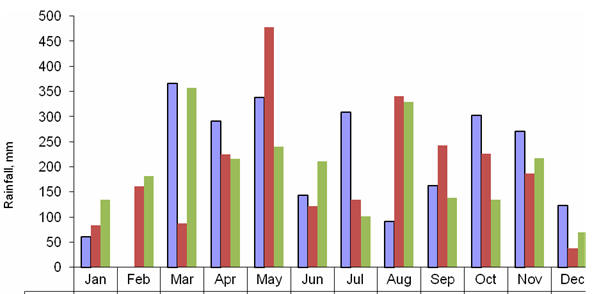 |
| Figure 9. Monthly rainfall in TOSOLY farm (2007-2009) |
The farm is situated at 1500 masll and occupies an area of 7ha on a hillside with overall slope of 20% (difference in height of 60m over a distance of 350 m). Traditionally the soils in the region have been, and continue to be, exploited for shade "Arabica" coffee and small scale production of “Panela” from sugar cane. In order to promote biodiversity, the crops on the farm are replicated in different areas (Map 1).
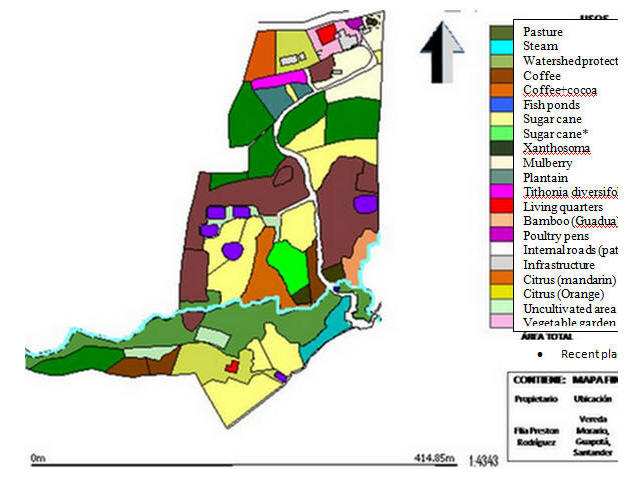 |
| Map 1. Distribution of the cropping areas in TOSOLY farm |
The principal crop is sugar cane (Photo 3), presently occupying 1.50 ha but projected to increase to 2 ha as the pasture areas are gradually displaced with more productive crops. Tree crops include coffee, cocoa, and forage trees (chiefly mulberry [Morus alba] (Photo 4], and “Boton de oro” [Tithonia diversifolia] (Photo 5), forage plants (New Cocoyam [Xanthosoma Sagittifolium] (Photo 6) and Water spinach [Ipomoea aquatic] (Photo 7) and trees for timber and fuel, including a grove of ‘Guadua”(Guadua angustifolia) (Photos 8 and 9), and for shading the coffee (Photo 10).
|
|
|
|
Photo 3. Sugar cane is distributed in different areas of the farm always in close proximity to trees |
Photo 4. Mulberry (Morus alba) is the major protein source for goats, cattle and rabbits |
|
|
|
|
Photo 5. "Boton de oro" (Tithonia diversifolia) has excellent agronomic properties and is fed to the goats along with the mulberry foliage |
Photo 6. New Cocoyam (Xanthosoma saggitifolium) is the preferred protein source for the pigs |
|
|
|
|
Photo 7. Water spinach (Ipomoea aquatica) is a protein-rich vegetable for people and animals. |
Photo 8. "Guadua (Guadua angustifolia) finds major uses on the farm for construction (Photo 7) |
|
|
|
|
Photo 9. " Guadua" provides the support structure of the plastic canopy for drying the coffee beans, the bagasse and the stems of mulberry and Tithonia |
Photo 10. Guamo (Inga hayesii Benth) is the traditional shade tree for coffee |
The live stock and fuel components are chosen for their capacity to utilize the crops and byproducts produced on the farm. Sugar cane stalk is fractionated into juice and residual bagasse. The tops including the growing point and some whole stalk are the basal diet for dual purpose cattle and goats. The juice is the energy feed for pigs (Photo 11) and the source of “sweetener” for cooking for the farm family.
|
|
|
Photo 11. Sugar cane juice is the basal diet for the pigs |
The bagasse (Photo 12) is the fuel source for a gasifier (Photo 13) that provides combustible gas for an internal combustion engine linked to an electric generator.
|
|
|
|
Photo 12. The bagasse is sun-dried and separated into fine (on the left) and coarse particles (on the right); the former for the gasifier and the latter as litter for the cattle and goats |
|
The goats are the means of fractionating the forage trees (Photo 14), consuming the leaves, fine stems and bark as sources of protein, with the residual stems being another source of fuel in the gasifier.
|
|
|
|
Photo 13 The down-draft gasifier for converting fibrous biomass to electricity |
Photo 14. Goats are very efficient in fractionating the mulberry and the Tithonia, consuming the leaves and leaving the stems for the gasifier |
The pig unit has capacity for 40 growing-fattening pigs and 5 sows (Photo 15a,b).
|
|
|
|
Photo 15a,b. New housing for pregnant and lactating sows uses local materials and a construction technique (" el muro tendenoso") that reduces cement needs by more than 50% and eliminates need for bricks. The amount of "embedded" fossil fuel energy is much reduced by this system. |
|
The goat unit (Photo 16) has 10 breeding does and 2 bucks. There is one crossbred cow and progeny (Photo 17), kept for triple purpose production of milk, meat and manure.
|
|
|
| Photo 16. The coarse bagasse not suitable for the gasifier is an excellent bed for the goats. Mulberry and Tithonia are suspended in racks, a technique that has been shown to stimulate feed intake (Theng Kouch et al 2003) | Photo 17. A multi-purpose cow produces, milk, meat and manure |
Hens (n=40) and ducks (n=6) are raised in foraging, semi-confinement systems (Photos 18 and 19) for eggs and meat.
|
|
|
| Photo 18. Foraging hens help to control the weeds under the forage trees | Photo 19. Duckweed (Lemna minor) is highly appreciated by foraging ducks |
Production of Guinea pigs is a new venture on the farm, applying the principles of 100% forage diets developed in Cambodia, Laos and Vietnam (http://www.mekarn.org/prorab/content.htm) (Photo 20).
|
|
|
|
|
Photo 20. Guinea pigs are fed exclusively on forages produced on the farm |
A horse serves to transport sugar cane and forages (Photos 21and 22).
|
|
|
|
Photos 21 and 22. Horses do not need fossil fuel |
|
All high moisture wastes are recycled through plug-flow, tubular plastic (Polyethylene) biodigesters. Pig and human excreta are the feedstock for six biodigesters (Photo 23). Waste water from coffee pulping, washing of dishes and clothes go to a seventh biodigester (Photo 24).
|
|
|
|
Photo 23: Six biodigesters receive washings from the pig pens and from the family toilets |
Photo 24: Waste water from the kitchen, the clothes washer and the machine for pulping fresh coffee beans is directed to this biodigester |
Effluents from all biodigesters are combined (Photo 25) and recycled to the crops as fertilizer.
|
|
|
|
|
Photo 25. Effluents from all the biodigesters are recycled to the crops and forages as fertilizer |
The pens for the goats and cattle have clay floors covered with a layer of bagasse to absorb the excreta (Photos 16 and 17). Periodically this manure is returned to the crops as fertilizer and as a source of organic matter (Photo 26).
|
|
|
|
|
Photo 26. Manure from the cattle and goats is a major source of fertilizer and organic matter for recycling to the crops |
The features and links of the farming system are shown in Figure 10.
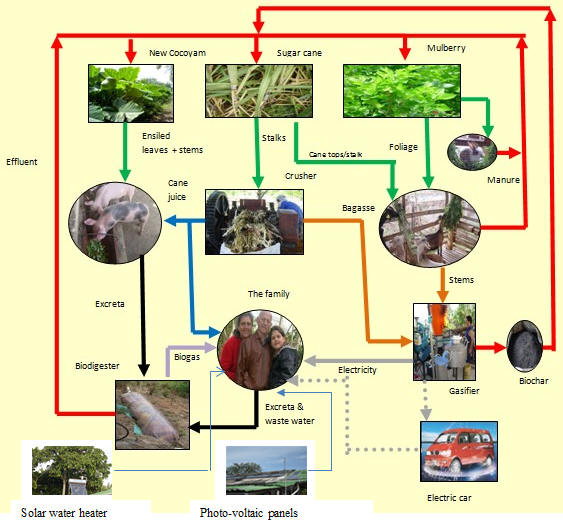 |
| Figure 10. The features and links of the farming system in TOSOLY |
Energy on the farm is produced mainly by gasification of the sugar cane bagasse and the stems from the mulberry and Tithonia forages (Table 6). The photovoltaic panels (1200 W installed capacity) are estimated to yield 8 KWh daily. The 8 biodigesters produce 6m3 daily of biogas, two thirds of which is converted to electricity (6 KWh/day) using it as fuel in the same IC motor-generator attached to the gasifier. The remainder is employed for cooking. Low grade heat energy, produced by the solar water heater and the wood stove, is not included in the energy balance. After deducting the electricity used to drive the farm machinery and to supply the house the potentially exportable surplus is 104 KWh daily, which at the current price of electricity (USD0.20/KWh), would yield an annual return of USD 7,600.
The gasifier produces 4.4 tonnes of biochar yearly which is returned to the soil. Assuming that the 65% of carbon in the biochar is not oxidized in the soil (Lehman 2007), then the effective sequestration of carbon dioxide is of the order of 11 tonnes annually.
|
Table 6. Production, consumption and exportable surplus of renewable energy |
||||||||||
|
Size |
Yield, t/ha |
Yield, t/y |
Juice, t |
Bagasse DM |
KWh/yr |
KWh/d |
COP/d |
USD/d |
USD/y |
|
|
Production |
||||||||||
|
Sugar cane |
2 ha |
80 |
160 |
104 |
24032 |
20027 |
54.9 |
|||
|
Mulberry/Tithonia |
1 ha |
100 |
100 |
20000 |
16667 |
45.7 |
||||
|
Solar panels |
1200W |
8.0 |
||||||||
|
Biodigester |
18m³ |
6.0 |
||||||||
|
Total |
115 |
|||||||||
|
Consumption |
||||||||||
|
House |
8 |
|||||||||
|
Machinery |
3 |
|||||||||
|
Total |
11 |
|||||||||
|
Surplus to grid |
104 |
41412 |
20.7 |
7558 |
||||||
The energy balance (EROEI) was calculated to be 7.9:1 (Table 7).
|
Table 7. Calculation of the EROEI (Energy Return on Energy Invested) (Pteston and Rodriguez 2009) |
||||
|
Inputs |
MJ |
Outputs |
MJ |
EROEI |
|
Machinery |
6600 |
Producer gas |
221760 |
|
|
Human power |
11200 |
|
|
|
|
Diesel oil |
1460 |
Biogas |
40150 |
|
|
Animal feed |
10000 |
|
|
|
|
Construction |
4125 |
|
|
|
|
Totals |
33205 |
|
261910 |
7.9 |
Chaisson E J 2008 “Long-term Global Heating from Energy Usage,” Eos transactions of the American Geophysical Union, v89, no28, p253, 2008.
Nordell B 2003 Thermal pollution causes global warming. Global and Planetary Change, 38: 305-12.
Nordell B and Gervet B H 2009 Global energy accumulation and net heat emissions. International Journal of Global warming !378-391