Prediction and evaluation of methane emission of growing
cattle diets in Vietnam based on fecal near infrared reflectance spectroscopy
Tran Hiep, Dang Vu Hoa*, Vu Chi
Cuong* and Nguyen Xuan Trach
Faculty of Animal Sciences and Aquaculture
Hanoi University of Agriculture - Vietnam
hiep26@yahoo.com
*National Institute of Animal Sciences - Hanoi - Vietnam
The objective of the study was to
estimate methane emission based on growing cattle diet intake and to develop
prediction model for methane emission based on fecal NIRS that can be applied in
practice. An experiment was carried out during 6 months (February – September)
in the experimental station of National Institute of Animal Sciences (Vietnam).
Five growing cattle were used in a 5 x 5 Latin square (5 diets x 5 periods)
design and fed 5 diets based on forages and by-products used in northern Vietnam
(NaOH treated rice straw, Napier grass, cassava leaf meal, cassava root meal, cotton
cake and molasses). Feed intake was measured to estimate methane emission using
an equation developed by Moe and Tyrell (1980). Fecal samples were scanned twice
by a Foss NIRsystem 5000 monochromator to collect spectra. Methane-fecal pair
database was then used to perform different mathematical techniques in WinISI
software to select best model for methane prediction.
Methane emissions (liters/kg DMI)
were negatively correlated to DMI intake. Methane production was
positively correlated with NDF (r = 0.75) and ADF (0.69) but negatively
correlated with ME concentration (r = - 0.34), CP content (r = - 0.0) and ADL
content ( r = - 0.14). As a consequence, methane emission were lower with a diet containing cassava leaf plus molasses (49.3
liters/kg DMI) compared with a diet containing only Napier grass (63.2 litres/kg DMI). It was also
shown that the energy loss from methane emissions was about 12.7%.
Keywords: Fecal NIRS, growing cattle, methane
emission.
Introduction
While carbon dioxide receives the most attention as a
factor in global warming, there are other gases to consider, including methane.
In an effort to combat global warming, reducing methane emissions is an
attractive target. Firstly, methane has a global warming potential 300 times
that of carbon dioxide (Aydinalp and Cresser 2008). Secondly, methane is broken
down quite rapidly in the atmosphere; within 9-15 years (FAO 2006). Therefore a
fall in methane emission would quickly result in a reduction in atmospheric
greenhouse gas concentration.
Methane production in the digestive tract of ruminants,
called enteric fermentation, is one of the major sources of global methane
emissions. According to the recent FAO report ‘Livestock’s Long Shadow’, enteric
methane emissions amount to almost 86 million tonnes of methane each year (FAO
2006). With an extra 17.5 million tonnes of methane produced from manure,
livestock are responsible for 37% of anthropogenic methane, in which buffaloes
and cattle contribute about 80% of the global methane emissions from domestic
livestock annually (FAO 2006; Aydinalp and Cresser 2008). It is thus necessary
to estimate methane emissions from ruminant in order to find out methods to
reduce methane production from these animals.
However, determination of methane emission in ruminant has
met with much difficulty due to cost of modern equipment and technical skills (Johnson
1995; McCaughey et al 1997, 1999). Some measurement techniques
based on diet intake and quality have been developed (Benchaar
et al 2001; Boadi and Wittenberg 2002; Hegarty 1998;
Kebreab et al 2008;
Mills et al 2003; Wilkerson 1995) but the application is limited due
to the large variation of feed types in ruminant diets under farm conditions that
present complications in assessing feed intake, especially in tropical
countries such as Vietnam. So, a simple technique for methane emission that
could be applied on farm is needed.
Materials
and methods
Location
The in vivo experiment was done at the
experimental station of National Institute of Animal Sciences (NIAS).
Animals and diets
The experiment involved 5 growing cattle of 115-140 kg. Each
animals was housed in a tie-stall to allow intake measurement. Five
diets were formulated using forages and
by-products available in north Vietnam (Table 1 and Table 2).
|
Table 1.
Ingredients in five experimental diets
|
|
|
RS-CLM |
RS-SBM |
NG |
NGCLM-CRM |
MU-CLM |
|
NaOH treated rice straw |
Ad
lib |
Ad
lib |
|
|
|
|
Cassava leaf meal |
1% BW |
|
|
0.5%
BW |
Ad
lib |
|
Soybean cake |
|
1% BW |
|
|
|
|
Napier grass |
|
|
Ad lib |
Ad lib |
|
|
Cassava root meal |
|
|
|
0.5% BW |
|
|
Molasses-urea |
|
|
|
|
1% BW |
|
Table 2. Chemical composition of dietary
ingredients (% in DM) |
|
|
CP |
NDF |
ADF |
Lignin |
|
NaOH treated rice straw |
5.64 |
78.2 |
46.4 |
6.32 |
|
Cassava leaf meal |
16.8 |
34.6 |
30.2 |
7.80 |
|
Napier grass |
12.2 |
62.6 |
38.7 |
5.16 |
|
Cassava root meal |
2.65 |
5.40 |
3.39 |
1.50 |
|
Soybean cake |
50.2 |
13.90 |
9.70 |
- |
|
Molasses-urea |
13.00 |
- |
- |
- |
Experimental design
A 5 x 5 Latin square (5 diets x 5
periods) design was used. Each period lasted for 3 weeks (2 for adaptation and 1
for measurement).
Intake measurement
For each animal, the daily forage and concentrate intake
was individually determined. Forage refusals were weighed the next morning.
Sampling procedure
Approximately 500 g on a fresh matter basis of each
ingredient were collected every methane estimating day. Fecal samples were
collected directly from the rectum in the next morning. They were then dried in a
forced-air oven at 70°C for 48 h to determine DM content. All dried samples were
ground through a 1 mm screen and stored in closed plastic boxes at room
temperature before NIRS analyses.
Chemical composition
Chemical composition of each feed (ash, CP, NDF and ADF)
were predicted according to a large NIRS database and equations from Gembloux
(Belgium) and Cirad (France) databases. For concentrate feeds, composition and
feeding value data were collected from the local suppliers.
Methane emission estimation
The total methane production was estimated using an
equation developed by Moe and Tyrell (1980): [CH4 litres/day = 86.1+67.0*Cell+43.9*
Hemi+12.9*Starch and Sugar]; (kg ingested/day on DM basis)].
NIRS Measurements and Spectral Treatments
All samples were scanned twice at 2 nm intervals over the
1100 – 2498 nm wavelengths by a Foss NIRsystem 5000 monochromator (Silver
Spring, MD, USA). The samples were scanned using closed cells, and NIR
absorbance data were recorded as mean log 1/Reflectance values
(log 1/R). Mathematical treatment of the spectral data was
performed using WinISI software (Infrasoft International; Shenk 1992) to
evaluate standardized Mahalanobis distance (H). Before calibration and
validation was performed, mathematical pretreatments, standard normal variate
and detrend, and different derivative pretreatments were applied to spectral
data.
Model calibration
The models were developed
using estimated methane production database (reference database) and fecal
spectra database using WinISI software. Firstly, methane production and fecal
spectra were paired. Then, methane-fecal pair database was used to perform
different mathematical techniques to select best model for methane emission.
Model evaluation
The statistical parameters used to evaluate the accuracy of
the calibration and validation dataset were standard error of prediction (SEP), relative standard error of prediction (RSEP%), ratio performance deviation (RPD), and
coefficient of determination (R²).
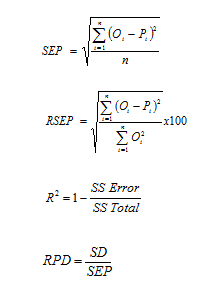
Where n = number of pairs; Oi
= observed values of the diet component i; Pi = predicted values of the diet
component i by the calibration or validation model; SS Error = sum of squares of
error; SS Total = total variation in the model; SD = standard deviation of the
original data.
The SEP and RSEP show the robustness of the model. A
prediction model was considered satisfactory if R² > 0.8, and 10%
£ RSEP
£ 20%, good if R² > 0.8 and RSEP < 10%,
and excellent if R² > 0.9 and RSEP < 10%.
Statistical analysis
The data from each experiment were analyzed by the General
Linear Model option in the ANOVA program of SAS system Software (version8.0).
Results and Discussion
Diet intake
Dietary composition and intake are given in Table 3 and indicate that the
quality of molasses (MO) supplement diet (MU-CLM) was highest based on its low
fiber content but high protein content and energy concentration. Conversely, the
quality of NaOH treated rice straw (RS) basal diet supplemented with cassava
leaf (CL) (RS-CLM) was lowest due to its high fiber but low protein and energy
concentration. However, the soybean cake supplement increased significantly
protein and energy of the RS basal diet (RS-SBM compared with RS-CLM).
Otherwise, the supplement of both cassava root meal (CR) and cassava leaf to the
Napier grass (NG) basal diet reduced fiber and protein contents (NGCLM-CRM compared
with N).
|
Table 3. Main
statistics of diet chemical composition and intake |
|
Variables |
RS-CLM |
RS-SBM |
NG |
NGCLM-CRM |
MU-CLM |
SEM |
Prob |
|
Diet
composition |
|
|
|
|
|
|
|
|
Energy, kcal ME/kgDM |
1885a |
2017b |
2251c |
2317d |
2329d |
16.81 |
*** |
|
Protein, % DM |
8.84a |
15.66c |
12.17d |
10.89b |
16.01c |
0.33 |
*** |
|
NDF, % DM |
65.55a |
63.58ab |
62.58ab |
61.42b |
27.37c |
1.40 |
*** |
|
ADF, % DM |
41.75a |
38.14b |
38.74b |
35.70c |
23.89d |
0.67 |
*** |
|
Dry
matter intake |
|
|
|
|
|
|
|
|
Total DM intake, kg/day |
3.71a |
3.67a |
3.18b |
3.75a |
2.88c |
0.06 |
*** |
|
DM
intake, % BW |
3.28a |
3.14a |
2.62b |
3.16a |
2.42b |
0.05 |
*** |
|
Protein
and fibre intake |
|
|
|
|
|
|
|
|
CP intake, g/day |
322.70a |
574.00b |
458.40c |
408.18c |
460.90c |
11.25 |
*** |
|
NDF intake, g/day |
2 457.00a |
2 334.70a |
1 998.00b |
2 304.00a |
787.50c |
66.41 |
*** |
|
ADF intake, g/day |
1 559.20a |
1 400.60b |
1 140.90c |
1 453.10ab |
687.40d |
36.42 |
*** |
|
abcd Means without common letter are different
at P<0.05 |
The high and similar levels of DMI intake were found for RS basal diets (RS-CLM) and NG supplemented with both CR and CL (NGCLM-CRM).
The diet using solely NG and diet
using MU-CLM provided much lower level of intake compared with the others (about 27% lower).
CL, SC and/or CR supplement improved significantly level of intake of growing
cattle, especially on the low quality
diet. As a consequence, these supplements increased considerably fiber intake.
However, CP intake was much improved only with RS basal diet supplemented with
SC (RS-SBM).
Methane emission
Variation of methane emission
over 5 different diets is shown in table 4. High and similar levels of total
methane emission were found in RS-CLM diets. The lower level of methane was
emitted from NG and MU-CLM. According to Giger-Reverdin et al
(2000), methane emission increased with level of intake. So, it is expected
that the three diets that had high intake must emit more methane.
In terms of rate of methane emission, expressed as liters of methane/kg DMI,
MU-CLM produced least methane per unit DM intake. Giger-Reverdin et al.
(2000) reported that methane emission (liters/kg DMI) reduces by the increase in
both the level of intake and concentrate proportion in the diet. That means
methane efficiency is improved as the increase in intake. Here, N and 5 had
low intake but methane efficiency was oppositely obtained. MU-CLM provided
highest efficiency whereas N had lowest efficiency. This illogicality was
caused by different diet quality. MU-CLM containing high protein and energy
concentration could provide high digestibility. On the contrary, other diets
containing high fiber content theoretically provided low digestibility. The
increase in the retention time of feed in rumen facilitates the activity of
methanogenic bacteria and as a consequence, the methane emission increased.
|
Table 4. Main
statistics of methane emission and efficiency |
|
Variables |
RS-CLM |
RS-SBM |
NG |
NGCLM-CRM |
MU-CLM |
SEM |
Prob |
|
Methane
emission, liters/d |
218.9a |
212.16ab |
200.68b |
218.02a |
140.87c |
3.25 |
*** |
|
Methane emission,
liters/kg of intake of |
|
|
|
|
|
|
|
|
DM |
60.05a |
58.37a |
63.18b |
58.22a |
49.32c |
0.56 |
*** |
|
NDF |
92.11a |
92.29a |
102.75b |
94.854a |
180.11c |
3.18 |
*** |
|
ADF |
144.19a |
153.73a |
183.13b |
150.34a |
206.35c |
2.57 |
*** |
These findings are similar to results reported by Lassey et al (2002)
and Primavesi et al (2004). They found that high fiber forages emitted more
methane than lower fiber forages due to their lower
digestibility. So, supplements of protein and energy sources such as CL, SC, MO to
the low quality forage (RS) in this study could improve feed conversion
ratio and decrease methane due to the increase in digestibility of the whole diet.
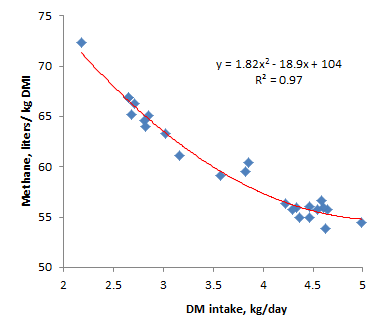
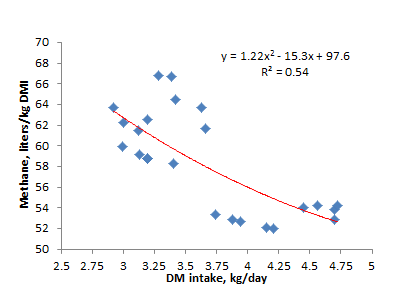
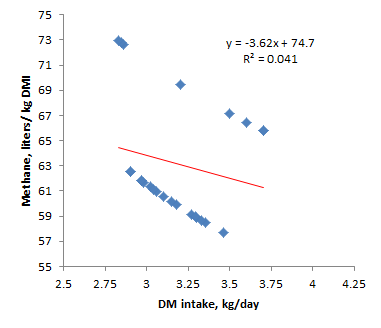
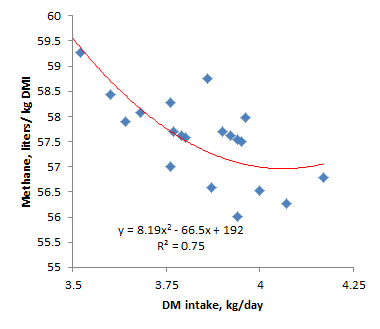
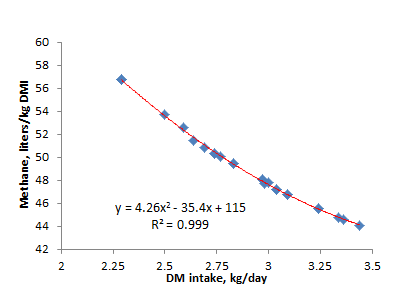
Figures 1 and 2 illustrate that the methane emissions per unit DM intake were
reduced with level
of intake but increased with the increase in fiber content.
 |
 |
|
Figure 1a. Correlation
between total DM intake and methane emission rate (NaOH-treated rice
straw + CLM) |
Figure 1b. Correlation
between total DM intake and methane emission rate (NaOH-treated rice
straw + soybean meal) |
 |
 |
|
Figure 1c. Correlation
between total DM intake and methane emission rate (napier grass) |
Figure 1d. Correlation
between total DM intake and methane emission rate (napier grass +
CRM + CLM) |
 |
|
|
Figure 1e. Correlation
between total DM intake and methane emission rate (molasses + CLM) |
 |
|
Figure 2. Correlation
between total DM intake, NDF content and methane emission rate |
Energy loss
Estimates of energy loss from methane are presented in table 5. The energy loss from methane emissions varied from 10 to 14%
of the gross energy
intake, lowest in MU-CLM and highest in RS-CLM diets. The supplement
of CR and CL to tge NG basal diet reduced the energy loss from methane.
The results are slightly higher than those reported by Johnson et al. (1993) and Kujawa (1994). They found that the energy loss from methane varied from
approximately 2 to 12% of GE intake.
|
Table 5.
Estimation of energy loss from methane emission |
|
|
RS-CLM |
RS-CLM |
RS-CLM |
RS-CLM |
RS-CLM |
SEM |
P |
|
Energy intake,
kcal GE/d |
14 999a |
15 491ab |
13 769c |
16 320b |
12 561d |
222.71 |
*** |
|
Energy loss |
|
|
|
|
|
|
|
|
Methane emission, liters/d |
218.9 |
212.16 |
200.68 |
218.02 |
140.87 |
3.25 |
*** |
|
Energy loss, kcal GE/d |
2079 |
2005 |
1874 |
2037 |
1326 |
30.32 |
*** |
|
Energy loss ratio, % |
13.86a |
12.94ab |
13.61a |
12.48b |
10.55c |
0.14 |
*** |
Diet intake and methane prediction
(Local calibration)
Methane emission from ruminant is affected by factors concerning diet quality
and digestibility
(intake, concentrate level, type of carbohydrate, feed processing, addition of
lipids and nitrate, alterations to the microflora…) (Giger-Reverdin et al. 2000).
So, any approach to evaluate these factors should be used to estimate
methane emission.
The fecal NIRS, as illustrated by many studies, could predict accurately intake,
diet quality and digestibility (Boval et al. 2004). Awuma (2003) reported that
the voluntary organic matter intake (OMVI) and digestibility in cattle could be
predicted by fecal NIRS with high R² (> 0.8) low RSEC (6%). For sheep, Fanchone
et al. (2007) estimated the OMVI with an acceptable accuracy with RSEC equal to
12%. More recently, Decruyenaere et al. (2008) demonstrated that the OMVI of
ruminants was successfully predicted by fecal NIRS equations with R² ranging
from 0.80 to 0.90, and low RSEC (8%). Concerning diet quality, Lyons and Stuth
(1992) found that fecal NIRS could predict diet quality
(OMD, CP) with equal or better accuracy than NIRS equations using
forage spectra and that it had the same accuracy as conventional analysis
methods. Gibbs et al. (2002) also indicated that fecal NIRS profiling can be
developed to distinguish total diet quality from animals fed forage resources of
varying quality and concentrates in different proportions. So, fecal NIRS method
could be promisingly used to develop prediction model for methane emission.
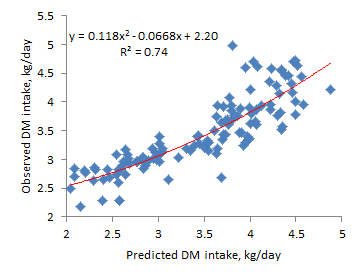
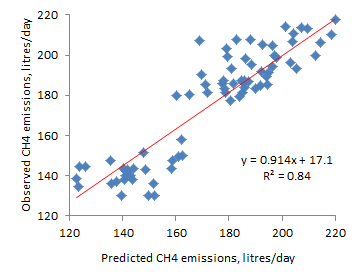
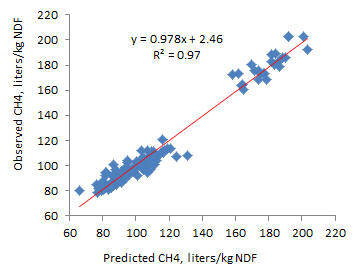
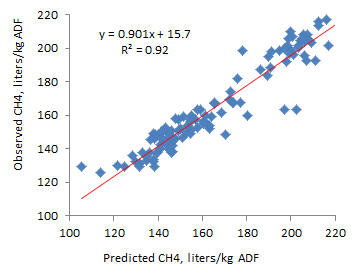
The calibration statistics of equations for diet intake and methane emission are
summarized in Table 6 and Figure 3. Results show that relative standard error of
prediction (RSEP) and coefficient of determination (R²) for all variables were
about 8.07% and 0.77, respectively.
The highest predictive capacity was found for equations concerning DM intake
(DMI equation and methane efficiency equation (liters/kg DMI)). These equations
had low RSEP (9.28% and 4.81%) and good R² (0.83 and 0.85), respectively
for DMI and methane emissions rate, expressed by liters/kg DMI.
|
Table 6.
Prediction statistics of NIRS equations for diet intake and methane
emissions |
|
Variables |
SEP |
RSEP |
RPD |
R² |
|
Diet intake,
kg/d |
|
|
|
|
|
DM intake |
0.33 |
9.28 |
2.42 |
0.83 |
|
NDF intake |
0.18 |
10.89 |
1.98 |
0.76 |
|
ADF intake |
0.10 |
10.47 |
1.90 |
0.72 |
|
Methane
emissions, liters |
|
|
|
|
|
CH4 production, /d |
16.17 |
9.87 |
1.78 |
0.71 |
|
CH4 emission rate, /kg DM
|
2.30 |
4.81 |
2.54 |
0.85 |
|
CH4 emission rate, /kg NDF |
6.45 |
6.12 |
1.98 |
0.74 |
|
CH4 emission rate, /kg ADF |
8.61 |
5.02 |
2.10 |
0.77 |
According to Fuentes-Pila et al (1996, 2003) the precision of a prediction
model is considered as good, acceptable or unsatisfactory when RSEC is lower
than 10%, between 10% and 20% or higher than 20% of the mean observed values,
respectively. Moreover, the R² and RPD values of a prediction model must be
higher than 0.80 and 2.0, respectively (Valdés et al 2006, Williams, 2004). The
present predictive statistics showed good prediction capacity of equations
concerning DMI. Other equations showed less satisfactory capacity of
prediction. This was probably due to the limited data for developing prediction
equations based on fecal NIRS. Therefore, it is needed to enlarge the data base
in order to make good predictive capacity of these equations.
Conclusions
-
The supplement of CL, CR and SC
increased significantly the intake of a high-fibre forage diet, reduced methane
emissions, and as a consequence increased feed utilisation efficiency. In term of
rate of methane per unit DM intake, the supplement of CL or SC to RS basal diet
showed lower values than on the NG diet. These findings are significant for
cattle feeding systems based on forages.
-
The fecal NIRS method provides an opportunity to develop prediction models for methane emissions from
dairy cattle. These advantages are without any additional
requirements for details of diet composition. We conclude that this
technique can be used as a rapid and efficient tool for diet monitoring.
However, it is
also needed to enlarge the data base to make prediction equations more accurate. Finally,
a portable system of spectra measurements directly on farms would be interesting
to facilitate this approach.
References
Aydinalp C and Cresser M S 2008
The Effects of Global Climate Change on Agriculture.
American-Eurasian J. Agric. & Environ. Sci., 3 (5): 672-676.
Awuma K. S 2003 Application
of NIRS fecal profiling and geostatistics to predict diet quality of African
livestock. Thesis submitted to the Office of Graduate Studies of Texas A&M
University in partial fulfillment of the requirements for the degree of Doctor
of Philosophy.
Benchaar C,
C. Pomar and J Chiquette 2001 Evaluation of
dietary strategies to reduce methane production in ruminants: A modelling
approach. Can. J. Anim. Sci. 81:563–574.
Boadi D A and K M Wittenberg
2002 Methane production from dairy and beef heifers fed forages differing in
nutrient density using the sulphur hexafluoride (SF6) tracer gas technique.
Can. J. Anim. Sci. 82:201–206.
Boval M, D B Coates, P Lecomte,
V Decruyenaere, and H Archimède 2004 Faecal near infrared reflectance
spectroscopy (NIRS) to assess chemical composition, in vivo digestibility and
intake of tropical grass by Creole cattle Animal Feed Science and Technology
114(1-4):19-29.
Decruyenaere V, P Lecomte, C
Demarquilly, J Aufrere, P Dardenne, D Stilmant and A Buldgen 2008
Evaluation
of green forage intake and digestibility in ruminants using near infrared
reflectance spectroscopy (NIRS): Developing a global calibration. Anim. Feed
Sci. Technol. doi:10.1016/j.anifeedsci.2008.03.007.
Fanchone A, M Boval, P Lecomte
and H Archimède 2007 Faecal indices based on near infrared spectroscopy to
assess intake, in vivo digestibility and chemical compositon of the herbage
ingested by sheep (crude protein, fibres and lignin content). J. Near Infrared
Spectroscopy 15:107-113.
Fuentes-Pila J, M A DeLorenzo,
D K Beede, C R Staples and J B Holter 1996 Evaluation of Equations Based on
Animal Factors to Predict Intake of Lactating Holstein Cows. J. Dairy Sci. 79(9
%U http://jds.fass.org/cgi/content/abstract/79/9/1562 %8 September 1,
1996):1562-1571.
FAO 2006 Livestock’s Long
Shadow. Livestock, Environment and Development (LEAD) Initiative, Rome.
Available at (accessed 18 Oct 09):
http://www.virtualcentre.org/en/library/key_pub/longshad/A0701E00.pdf
Giger-Reverdin
S, D Sauvant, M Vermorel and J P Jouany 2000
Modélisation empirique des facteurs de variation des rejets de méthane par les
ruminants. Renc. Rech. Ruminant 7.
Hegarty R S
and R Gerdes 1998 Hydrogen production and transfer
in the rumen. Rec. Adv. Anim. Nutr. 12:37–44.
Johnson K A
and D E Johnson 1995 Methane emissions from
cattle. J. Anim. Sci. 73:2483–2492.
Johnson D E,
T M Hill, G M Ward, K A Johnson, M E Branine, B R Carmean and D W Lodman 1993
Principle factors varying methane emissions from
ruminants and other animals. In: M.A.K. Khalil (Ed.). Atmospheric Methane:
Sources, Sinks, and Role in Global Change. NATO A D 1 Series Vol 113,
Springer-Verlag, Berlin, Germany
Kebreab E, K A Johnson, S L Archibeque, D Pape and T Wirth 2008
Model for
estimating enteric methane emissions from United States dairy and feedlot
cattle. J. Anim Sci. 2008. 86:2738-2748.
Kujawa M A 1994
Energy partitioning in steers fed cottonseed hulls and beet pulp. Ph.D.
Dissertation. Colorado State Univ., Fort Collins.
Lyons R K and J W Stuth 1992
Fecal NIRS equations for predicting diet quality of free-ranging cattle. J,
Range Manage. 45:230-244.
McCaughey W
P, K Wittenberg and D Corrigan 1997 Methane
production by steers on pasture. Can. J. Anim. Sci. 77:519–524.
McCaughey W
P, K Wittenberg and D Corrigan 1999 Impact of
pasture type on methane production by lactating beef cows. Can. J. Anim. Sci.
79:221–226.
Mills J A N,
E Kebreab, C M Yates, L A Crompton, S B Cammell, M S Dhanoa, R E Agnew and J
France 2003 Alternative approaches to predicting
methane emissions from dairy cows. J. Anim. Sci. 81:3141–3150.
Moe P W and
H F Tyrrell 1979 Methane production in dairy cows.
J. Dairy Sci. 62:1583–1586.
Shenk J S and M O Westerhaus
1992 New Standardization and Calibration Procedures for NIRS Analytical
Systems. Pages 1694-1696. Vol. 31. Crop science.
Wilkerson V
A, D P Casper and D R Mertens 1995 The prediction
of methane production of Holstein cows by several equations. J. Dairy
Sci. 78:2402–2414.
Go
to top


