Evaluation of method for treating pig waste by applying a model of a fish
pond, followed a water-hyacinth pond in Vinh Khanh State Farm, An Giang Province
Luu Huu Manh*, Nguyen Nhut Xuan Dung, Nguyen Dang Tuan and Bui Thi Le
Minh
*Department of Veternary Medicine, Faculty of Agriculture and Applied Biology
Cantho University, Cantho, Vietnam
lhmanh@ctu.edu.vn
Abstract
A
study was carried out to evaluate a method for treating the wastewater
from pig pens (consisting of feces, urine and feed leftovers) by draining if to
fish and subsequently water-hyacinth ponds and to determine the effect of the
number of the pigs per unit of water surface on the water quality parameters: dissolved oxygen (DO), chemical oxygen demand
(COD), biochemical oxygen demand (BOD5), suspended solids (SS), total
nitrogen, total phosphorus, total Coliforms and parasitic eggs. Samples were taken from six
pig houses of the farm at two week intervals.
The results
show that the model was effective; the quality of the wastewater in the
water hyacinth pond met the government standards and reached type A (Vietnam Standard:
TCVN 5945 – 2005). The concentrations of COD, BOD5, SS, total
nitrogen and total phosphorus were significantly reduced as compared with
samples directly collected from the pens, except for Coliforms.
Increasing fishpond water surface area from 105m2 to 227m2/
pig improved water quality parameters. Water quality of the river surrounding the
pig farm area nearly reached type A according to Vietnam Standard TCVN 5942 -
1995.
Key words:
Biochemical parameter, pig manure, Vietnam standard, wastewater treatment
Introduction
An giang province has an agriculture- based economy. Pig
production is considered one of the most important livestock activities in the
province, mainly by smallholders. Recently, pig production has rapidly increased
to supply the demand for meat. The increased concentration of intensive
livestock in associated with the pollution and the pig waste is becoming a
serious environmental hazard. Livestock waste causes incessant and pervasive
damage to waterways, human health and aquatic life. Water bodies become
unusable, while in the remote areas people are still using these for their daily
activities. According to a study of Bui Thi Le Minh (2006), more than 25% of
householders had no waste treatment method. At the state farms, the common
method used to treat wastewater, consisting of faeces,
urine and leftover feeds is to directly drain the wasterwater into a closed
fishpond or into canals or rivers (Huynh Tan Tien, 2006). A model for the
wastewater treatment applied in Vinh Khanh state farm is to direct the wastes
from the pig farm to a fishpond, followed by a water-hyacinth pond, which is
considered a bio-pond. However, there is a lack of data on the wastewater
quality in the treatment ponds and in rivers surrounding the pig farm. The study
was undertaken by a team from the faculty of Agriculture and Applied Biology,
Cantho University to evaluate a more efficient treatment model and to find out
the optimum number of pigs per unit of water surface area to meet the government
standard (TCVN 5945 – 2005) by analysing the
waste water treatment ponds at Vinh Khanh state farm.
Materials and Methods
Pig farm
In total there were 931
pigs consisting of sows and boars (but excluding piglets). The pig numbers per unit
of fish pond are presented in Table 1.
|
Table 1:
Number of pigs per unit of water surface area of fish pond* |
|
Block |
Pig number (head) |
Surface area in fish pond m2/pig |
|
1 |
205 |
105 |
|
2 |
95 |
227 |
|
3 |
107 |
202 |
|
4 |
128 |
169 |
|
5 |
200 |
135 |
|
6 |
196 |
110 |
|
(*) Fish: catfish,
tilapia, silver carp and grass carp |
Sample collection
Samples were taken between 06:00 and 09:00h after cleaning the pigpens. The representative sites were chosen
from 6 blocks of pens (Figure 1) from which wastewater consisting of feces, urine and leftover feed were
discharged, piped and drained into the fishpond. For each block of pens, there were 4 selected
sample points. The first point was before the water pipe where the water flows into
the fish pond. The second point was between
the entrance and exit to the fish pond. The third point was in the fishpond and the fourth was
in the water hyacinth pond. Samples collected included four replicates. Water
samples in the river surrounding the farm were also taken at three points (up,
middle and down stream). The total number of samples was 100. They were held in plastic bottles,
previously cleaned by washing in non-ionic detergent, rinsed
with tape-water and finally with deionised water. During
sampling, the bottles were rinsed with the sample wastewater and then filled to the brim
from a depth of 20 to 30 cm below the level of the wastewater from each of the four designated
sampling points.
For COD
and DO analysis, samples were stored in dark bottle and a few drops of manganese
sulfate solution added to fix dissolved oxygen. Bottles were labeled,
transported to the laboratory and stored at 4°C prior to analysis
Analytical methods
Suspended
solids (SS) wére determined gravimetrically after oven drying at 105°C
(APHA 1995). Total nitrogen (Ntot) was determined using Kjeldahl digestion. Total phosphorus (Ptot) was determined by using a colorimetric
ascorbic-molybdate method after sample digestion with a H2SO4/H2O2
mixture (Murphy and Riley 1962). Samples for chemical oxygen demand (COD) and
five-day biological oxygen demand (BOD5) were stored at 20°C
and analysed by Winker’s method (APHA 1995). DO was also determined using
the Winkler method.
Total Coliforms were determined using the Most Probable
Number method (APHA 1998). The isolation and identification of parasitic
eggs were done by the methods of Fiilleborn (1920) and Benedek (1940). Evaluation of the water quality
was based on Industrial Wastewater Discharge Standards
(TCVN 5945-1995) according to the Environmental Law (ASEAN-10) (1998)
Statistical analysis
Data were subjected to analysis of
variance (ANOVA) using the General Linear Model (GLM) available in Minitab
13.2. The Tukey test in the same software was used to detect significant differences among treatment
means.
Results and Discussion
Effect of the fish pond and water hyacinth pond on biochemical parameters
At the
first sampling point, dissolved oxygen (DO) was zero due to the anaerobic conditions
(Table 2). Among the collection points, the
third site had highest DO values because the fish pond has a large open water
surface and so atmospheric oxygen could diffuse into the fish pond. In addition,
photosynthesis of algae provides oxygen for the fish pond and normally fish
require at least 4-5 mg/litre of DO to thrive (Corson 1990). This indicates that
water quality in the fish pond of the present study was acceptable. For aquatic plant systems, healthy water should contain
at least 5.2 mg/litre DO (Ademoroti 1996). There was a low concentration of DO in the
water hyacinth pond as compared to the fish pond because the water surface was
covered by the developing water hyacinth plants. In the river, DO was less than the type A of TCVN 5942-1995 concentration of 6 mg/litre.
Biological oxygen demand (BOD5) is a common parameter used in water
quality evaluation. BOD5 concentration at the first collection points
was very high and decreased rapidly with lowest level in the fish pond. Levels
in the the water hyacinth pond and in the river were within the allowable limits
(40 mg/litre for FEPA; 20
mg/litre FAO; 30 mg/litre type A of TCVN 5945-2005) for water used for
agricultural purposes. The fish pond and water hyacinth pond reduced the BOD5
in wastewater by approximately 90 and 98%, respectively.
However, according to WHO standard (2004), the permissible limit of BOD5
for drinking water is 0.0 mg/litre. This implies that there is a risk in
drinking the river water without treatment.
Chemical
oxygen demand (COD) is often used as a measure of
pollutants in natural and waste waters. High COD concentration indicates
the presence of chemical oxidants in water and low COD indicates otherwise. High
COD causes soil fixation, resulting in lower availability of nutrients for plants
(Chukwu 2005). The COD at the different sites followed a similar pattern to the
BOD5. The COD in the fish pond, water hyacinth pond and river were under FEAP’s
maximum limit of 80mg/litre and minimum limit of 50 mg/litre (type A of TCVN 5945-2005).
COD concentrations in the fish and water hyacinth ponds were reduced by
approximately 94 and 97%. In the river, COD was within the type A of TCVN
5942-1995 limit of 10 mg/litre.
The suspended solids (SS) also followed a
similar pattern to the BOD5. The values in the fish and water
hyacinth ponds and in the river were within
standards of FEFA and TCVN 5945-2005 for slurry discharge to surface water. The fish pond reduced approximately
91% of the SS from the pig farm. In the river, SS was within the type A of TCVN
5942-1995 of 20 mg/litre.
|
Table 2:
Effect of the fish pond
and water hyacinth pond on reducing
dissolved
oxygen, chemical oxygen demand, biochemical oxygen demand and
suspended solids |
|
No. pig/100 m2
water surface |
At entrance pipe |
Entrance to fish pond |
In fish pond |
Water hyacinth pond |
In river |
P |
|
DO, mg/litre |
|
0.44 |
0.00d |
1.89c |
4.69a |
1.94c |
4.30b |
<0.01 |
|
0.50 |
0.00c |
1.76b |
4.31a |
1.77b |
4.30a |
<0.01 |
|
0.59 |
0.00d |
1.75c |
4.05b |
4.05b |
4.30a |
<0.01 |
|
0.72 |
0.00d |
1.76c |
3.91b |
1.69c |
4.3a |
<0.01 |
|
0.74 |
0.00a |
1.56bc |
3.76b |
1.47c |
4.30a |
<0.01 |
|
0.95 |
0.00d |
1.40bc |
3.56b |
1.35c |
4.30a |
<0.01 |
|
COD, mg/litre |
|
0.44 |
145a |
17.4b |
8.49c |
3.94d |
3.30d |
|
|
0.50 |
146a |
17.5b |
9.21c |
3.93d |
3.30d |
|
|
0.59 |
207a |
19.1b |
9.55c |
4.45d |
3.30e |
|
|
0.72 |
212a |
19.2b |
9.86c |
4.81d |
3.30e |
|
|
0.74 |
215a |
19.9b |
10.3c |
4.88d |
3.30e |
|
|
0.95 |
218a |
26.1b |
13.7c |
5.05d |
3.30e |
|
|
BOD5,
mg/litre |
|
0.44 |
109a |
12.8b |
6.59c |
2.64d |
2.80d |
<0.01 |
|
0.50 |
117a |
13.3b |
7.26c |
2.72d |
2.80d |
<0.01 |
|
0.59 |
118a |
14.1b |
7.29c |
3.00d |
2.80d |
<0.01 |
|
0.72 |
118a |
14.3b |
7.71c |
3.59d |
2.80d |
<0.01 |
|
0.74 |
119a |
14.5b |
10.9c |
3.86d |
2.80d |
<0.01 |
|
0.95 |
127a |
19.6b |
11.7c |
3.95d |
2.80d |
<0.01 |
|
SS,
mg/litre |
|
0.44 |
1197a |
107b |
40.0c |
29.1d |
20.0e |
<0.01 |
|
0.5 |
1232a |
122b |
40.9c |
29.9d |
20.0e |
<0.01 |
|
0.59 |
1325a |
128b |
42.4c |
32.0d |
20.0e |
<0.01 |
|
0.72 |
1345a |
130b |
43.1c |
32.6d |
20.0e |
<0.01 |
|
0.74 |
1406a |
132b |
44.9c |
34.0d |
20.0e |
<0.01 |
|
0.95 |
1756a |
154b |
46.2c |
34.9d |
20.0e |
<0.01 |
|
a,b,c,d
Data in a row with
different letters differ at
P < 0.05 |
Chemical parameters
Total
nitrogen level was within the TCVN 5945-2005 standard of 23.9-41 mg/litre at the
first sample collecting site (Table 3), then rapidly decreased at the second, third and fourth sites and river. These values are low as compared to the type A of TCVN 5945-2005
standard of 15 mg/litre for wastewater. If there is a high concentration of nitrogen
in pig waste water discharged into a water body, some species of bacteria would
oxidize ammonia to nitrate, which promotes plant and algae development, leading
to water eutrophication.
Phosphorus levels revealed a
reduction of 91 to 97% from the initial pig waste water to the fish pond and
water hyacinth pond. The concentration of P in the water hyacinth pond
was within the type A of TCVN 5945-2005 standard of 4 mg/litre.
Nitrogen and phosphorus from manure are major pollutant sources and at low
levels, they cause an excess of algae. At high levels, phosphorus is toxic to
fish. Thus, the fish pond significantly reduced the amount of nitrogen and
phosphorus and the hyacinth pond takes up almost all the remaining phosphorus
before discharge into the river, which prevents the eutrophication of these
water bodies.
|
Table 3:
Effect of the fish pond and water hyacinth pond on total nitrogen
and phosphorus contents |
|
No. pig/100 m2
water surface |
Above pipe |
Above fish pond |
In
fish pond |
In water
hyacinth pond |
In River |
P |
|
Total nitrogen, mg/litre |
|
0.44 |
23.9a |
3.14b |
1.99c |
1.64c |
1.60c |
<0.01 |
|
0.50 |
24.6a |
6.96b |
1.96c |
1.64c |
1.60c |
<0.01 |
|
0.59 |
35.0a |
7.35b |
2.05c |
1.94c |
1.60c |
<0.01 |
|
0.72 |
35.9a |
8.26b |
3.16c |
2.44d |
1.60d |
<0.01 |
|
0.74 |
36.8a |
8.51b |
2.28c |
2.64c |
1.60d |
<0.01 |
|
0.95 |
41.0a |
9.26b |
2.30cd |
3.25c |
1.60d |
<0.01 |
|
Total phosphorus, mg/litre |
|
0.44 |
59.6a |
8.56b |
5.64c |
1.54d |
1.40d |
<0.01 |
|
0.5 |
75.9a |
11.9b |
6.93c |
1.70d |
1.40e |
<0.01 |
|
0.59 |
78.1a |
12.85b |
7.10c |
1.88d |
1.40e |
<0.01 |
|
0.72 |
81.3a |
14.0b |
9.16c |
3.12d |
1.40e |
<0.01 |
|
0.74 |
89.6a |
14.21b |
9.11c |
3.93d |
1.40e |
<0.01 |
|
0.95 |
111a |
14.75b |
9.20c |
4.55d |
1.40e |
<0.01 |
|
a,b,c,d,e
Data in a row with a different letters differ significantly (P <
0.05). |
Effect of the fish pond and water hyacinth pond on the microorganisms in
waste water
There was a significant reduction of Coliform bacteria in the fish pond as compared with
the wastewater before entering the pond (Table 4). The population of Coliform in
the fish pond was within the type B
of TCVN 5945-2005 standard of 5 x10³ MPN/100ml. Coliforms were
almost completely eliminated in the fish pond, where the large surface area was
subjected to UV irradiation; circulation by fish and the wind reinforced this effect. UV
irradiation is harmful to bacteria, but is a necessary factor in the development of
aquatic plants. The fishpond was high in dissolved oxygen (Table 2), which
is a potential stimulant for algae growth, some strains of which contribute
to increasing pH of the water, which is lethal to bacteria.
The population of Coliforms was high in the water hyacinth
pond. This could be
explained tby the fact that water hyacinth pond was deep (2.5m) and the abundance
of plants that covered the water surface prevented the penetration of the sun
rays to the bottom of the pond. Also the retention of the wastewater and
decomposing of dead roots in the water hyacinth pond allowed bacteria to work on the organic matter in the sewage. In the water hyacinth pond, the population of Coliforms was not within the type B of TCVN 5945-2005 of 5 x10³
MPN/100ml.
The
presence of Coliform bacteria indicates that the water source has been
contaminated with feces of humans or animals. Fecal Coliforms are not
usually pathogenic and live in the intestine of humans and animals. Some strains
of the Coliform Escherichia coli can cause
intestinal illness. When a water source is contaminated with fecal material,
some pathogenic diseases, such as typhoid, viral and bacterial gastroenteritis
can exist. Coliform bacteria is an indicator that a waterway possibly
contains other pathogenic organisms which could be a potential health risk. In the river,
the population of Coliforms was not within the type A of TCVN 5942-1995
of 5 x10³ MPN/100ml.
Parasitological determination showed that no parasitic eggs were found in the
fish and water hyacinth ponds. The efficiency of removal by the fish was
100%.
|
Table 4:
Changes in
microorganism population in water surface before and after the fish
pond and water hyacinth pond
|
|
No. pigs/100 m2
water surface |
Above pipe |
Before fish pond |
In fish pond |
In water hyacinth pond |
River |
P |
|
Coliform, MPN/100 ml |
|
0.44 |
- |
15 x 103 |
2.8 x 10³ |
11 x 104 |
2.8 x 10⁴ |
<0.01 |
|
0.5 |
- |
21 x 103 |
3.5 x 10³ |
24 x 104 |
2.8 x 10³ |
<0.01 |
|
0.59 |
- |
21 x 103 |
3.5 x 10³ |
24 x 104 |
2.8 x 10³ |
<0.01 |
|
0.72 |
- |
21 x 103 |
4.5 x 10³ |
24 x 104 |
2.8 x 10³ |
<0.01 |
|
0.74 |
- |
21 x 103 |
3.5 x 10³ |
24 x 104 |
2.8 x 10³ |
<0.01 |
|
0.95 |
- |
24 x 104 |
1.5 x 10⁴ |
46 x 105 |
2.8 x 10³ |
<0.01 |
|
Parasites, eggs/ litre |
|
0.44 |
6 |
0 |
0 |
0 |
0 |
|
|
0.5 |
1 |
0 |
0 |
0 |
0 |
|
|
0.59 |
1 |
0 |
0 |
0 |
0 |
|
|
0.72 |
4 |
0 |
0 |
0 |
0 |
|
|
0.74 |
1 |
0 |
0 |
0 |
0 |
|
|
0.95 |
8 |
0 |
0 |
0 |
0 |
|
|
a,b,c,d
Data in a row with a different letters differ significantly (P <
0.05). |
Effect of water surface per pig on the biophysical parameters and
microorganism in waste water
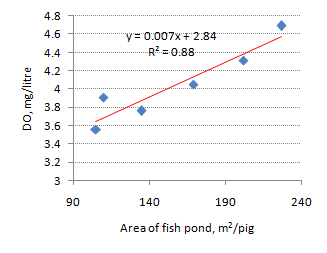
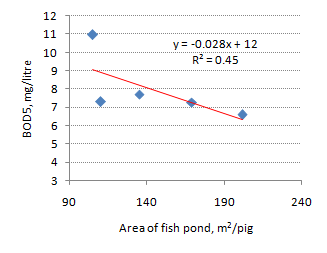
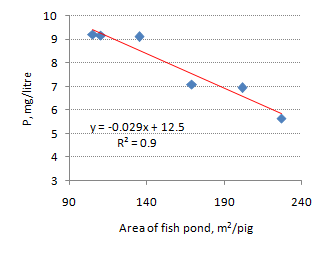
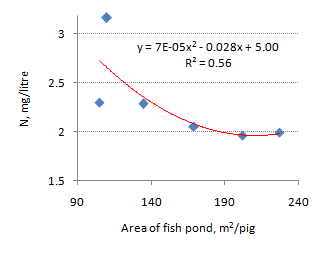
The trends in Figures 1 to 4 show that increasing the water surface are per pig significantly contributed to an improvement of
water quality in the fish ponds.
 |
 |
| Figure 1. Relationship between fish pond area per pig and
DO of the water in the fish pond |
Figure 2. Relationship between fish pond area per pig and
BOD5 of the water in the fish pond |
 |
 |
| Figure 3. Relationship between fish pond area per pig and
P content of the water in the fish pond |
Figure 4. Relationship between fish pond area per pig and
N content of the water in the fish pond |
Conclusions
-
The results of the study
indicate that the fish and water hyacinth ponds act as "bio" ponds in
reducing biophysical parameters and pathogens in the waste water from pig pens.
-
Water surface are per unit of pig population was
significantly related to improvements in water quality.
-
Water quality in the river surrounding the pig farm area reached
level type A according to Vietnam Standard TCVN
5942 – 1995, except for DO. The river water surrounding the farm did not contain
parasitic eggs nor animal waste.
References
Ademoroti C M A 1996 Standard Method for Water and Effluents Analysis. Foludex
Press Ltd, Ibadan pp.22-112.
APHA
1995 Standard for the Examination of Water and Wastewater, American Public
Health association, 18th Edition, p3-5.
APHA
1998 Standard methods for the examination of water and wastewater. 19th
Bui
thi Le Minh 2006 Danh gia muc do o nhiem moi truong nuoc mat va hieu qua cua
mot so mo hinh xu ly nuoc thai chan nuoi heo o nong ho. Master Thesis, Can tho
Univeristy.
Chukwu O
2005 Development of predictive models for evaluating environmental
impact of the food processing industry: Case studies of Nasco Foods
Nigeria Limited and Cadbury Nigeria PLc. Unpiublished Ph.D Thesis, DEA, FUT,
Minna Niger State, Nigeria.
Corson
WH 1990 Global Ecology Handbook: What You can do about the Environment
crisis. 2nd Edn. Beacon Press, Boston, USA, pp.245.Edition. American
Public health Association, Washington, DC pp 45-60.
FEPA 1990
Federal Environmental Protection Agency 1990 Guidlines and Standards for
Environmental Control in Nigeria, Abuja, Nigeria, 33-63
Fiilleborn F
1920 Ueber die Anpassung der Nematoden an den ...
Evolution of Parasites.
Third Symposium of the British Society of Parasitology.
Huynh
Tan Tien 2006 Tinh hinh o nhiem moi truong nuoc tu chat thai chan nuoi o mot
so trai chan nuoi heo tai TP Can tho. Master Thesis, Can tho University.
Murphy
J and Riley J P 1962 A modified single solution method for determination of
phosphate in natural waters. Analytical Chemistry, 27: 970-976.
Sarin
R, Ramteke D S and Moghe U A. Manual on water and waste water analysis,
pp.71-73.
TCVN
5945 1995 Wastewater, Industrial Discharge Standards
Asia-Pacific Centre for Environmental Law.
World
Health Organization 2004 “Guidelines for drinking water quality:
Recommendations”. WHO Publications, Geneva, 2004; 1: 30


