Biochar lowers net methane
production from rumen fluid in vitro
Sangkhom
Inthapanya, R A Leng* and T R Preston**
Abstract
Three experiments were carried out to evaluate
the effect of biochar on methane production from buffered ruminal fluid in an
in vitro system using cassava root meal as substrate with either potassium
nitrate or urea as the NPN source.
Experiment 1: The treatments in 2*2 factorial
arrangements with four replications of each treatment were: urea or potassium
nitrate as NPN source; and presence or absence of 5% biochar. The quantity of
substrate was 12 g DM to which was added 240 ml rumen fluid (from slaughtered
buffalo) and 960 ml of buffer solution. The incubation was for 24 and 48hours
with measurements of gas production, percent methane, substrate solubilized and
methane produced per unit substrate solubilized.
Gas production, methane percentage in the gas,
substrate solubilized and methane produced per unit substrate solubilized were
all lowered when nitrate replaced urea as the fermentable N source at either 24
or 48 hours of the incubation. Addition of biochar did not affect gas production
but increased the percentage DM solubilized. Methane produced and methane
produced per unit substrate solubilized was lowered by 14% due to addition of
biochar when urea was the NPN source but was not affected when nitrate was the
source of NPN.
Experiment 2: The treatments in a 2*6 factorial
with three replications were: (i) concentration of biochar (0, 1, 2, 3, 4 and 5%
on DM basis); (ii) washing or no washing of the biochar. The substrate was
cassava root meal and urea. The general procedure and analyses were similar to
those in experiment 1.
Methane produced was reduced by 11-13% by adding
1% biochar but there were no further benefits from increasing the biochar level
to between 2 and 5%. Methane production and per unit substrate DM solubilized
were reduced by about 5% by washed compared with unwashed biochar.
Experiment 3: The design was a completely
randomized comparison of: No biochar with urea, 0.5% biochar with urea, 1.0%
biochar with urea, 1% biochar with 50% urea and 50% potassium nitrate and 1%
biochar with 100% potassium nitrate (at 6% of diet DM).
Biochar at 0.5% reduced methane by 10% and at 1%
reduced it by 12.7%. With 50% nitrate N and 50% urea N, plus biochar at 1%,
the reduction in methane was 40.5% and with 100% nitrate N plus biochar at
1%, it was 49%.
Keywords: climate
change, fermentation, gas production, greenhouse gas
Introduction
Methane emissions from biological sources are a balance between production by
methanogenic Archae and oxidation by methanotrophic micro-organisms.
Methane oxidation has been reported in both aerobic and anaerobic environments,
which restricts the flux of methane entering the atmosphere (Hanson and Hanson
1996). Measurements in flooded rice fields indicated that a high proportion (up
to 80%) of the methane produced was oxidized at the soil surface (Hanson and
Hanson 1996). Both aerobic and anaerobic methanotrophic bacteria are unique in
their ability to utilize methane as a sole carbon and energy source.
Stocks and McCleskey (1964) isolated methane-utilizing bacteria from the rumen of steers
that were similar to methanotrophs isolated from soil and water and Mitsumori et
al (2002) demonstrated methanotrophs were present in both rumen fluid and
attached to the rumen wall. However, a study using an artificial rumen indicated
that only 0.3% of methane flux was oxidized (Kajikawa and Newbold 2000). Further
studies by Kajikawa et al (2003) indicated that 0.2 to 0.5 of the methane flux
was anaerobically oxidized by reversal of methanogenesis with sulphate as the
terminal electron acceptor.
Recent studies have demonstrated that the application of biochar in paddy soils
lowered methane release (Liu et al 2011) although other studies under different
conditions report the opposite (Zhanga et al 2010). It appears that amounts of
methane emissions will depend on the soil type, the chemical properties of the
biochar, and on the fertilization and water management regimes (Cai et al 1997).
However the decrease in methane emissions under biochar amendment in the
research of Liu et al (2011) was not the result of inhibition of the growth of
methanogenic archaea but to increased methanotrophic proteobacterial abundances
with greatly increased ratios of methanotrophic to methanogenic abundances in
the paddy soils as measured by real-time polymerase chain reaction (qPCR) and
PCR–DGGE (denaturing gradient gel electrophoresis) (Feng et al 2012). The
possibility of increasing methanotrophic activity in the rumen led us to examine
the effect of biochar amendment on ruminal fluid methane production in vitro
as a preliminary to whole animal research.
It is now
well established that nitrate
can replace urea as a major source of fermentable N (rumen
ammonia) in rations fed to ruminants (see Trinh Phuc
Hao
et al 2009)
and at the same time
it lowers
methane
production because
of it’s higher affinity for hydrogen as compared to carbon dioxide (see Leng
2008). In
preliminary studies the methane mitigating effect of biochar was seen and it was therefore
decided to examine the possibility of an additive effect of nitrate and biochar.
The hypothesis to be tested was:
Objectives
-
To test the effect of biochar on methane production from
buffered ruminal fluid in an in vitro system using cassava root meal as
substrate and with either potassium nitrate or urea as the NPN source.
Materials and methods
Three in vitro incubation experiments were conducted in the laboratory of
the Faculty of Agriculture and Forest Resources, Souphanouvong University, Luang
Prabang province, Lao PDR, from April to May 2012.
Experiment 1
The experimental design was a 2*2 factorial arrangement with four replications
of each treatment. Individual treatments were:
-
U: Urea at
2% of substrate DM
-
U-BC: Urea
with added biochar at 5% of substrate DM
-
KN:
Potassium nitrate at 6% of substrate DM
-
KN-BC: 6%
Potassium nitrate with added biochar at 5% of substrate DM
Cassava root meal was the
substrate added to provide the energy source in all incubations (Table 1).
|
Table 1.
Ingredients in the substrate (g DM basis) |
|
|
With biochar |
Without biochar |
|
|
Urea |
K-nitrate |
Urea |
K-nitrate |
|
Cassava root meal |
11.2 |
10.7 |
11.8 |
11.3 |
|
Biochar |
0.60 |
0.60 |
0 |
0 |
|
Urea |
0.24 |
|
0.24 |
|
|
K-nitrate |
|
0.72 |
|
0.72 |
|
|
12.04 |
12.02 |
12.04 |
12.02 |
The equipment and procedure was that used by Sangkhom Inthapanya
et al (2011).
Newly harvested cassava root was chopped into small
pieces of around 1-2 cm of length and dried in the oven for 24 h at 80°C and
then ground and passed through a 1 mm sieve. The biochar was produced locally by
burning rice husks in a top lit updraft (TLUD) gasifier stove (Olivier 2010).
The biochar had a particle size that passed through a 1 mm sieve and was
produced at a temperature of 900-1000oC. The biochar was
mixed with the cassava root meal and either potassium nitrate or urea (Table 1)
prior to adding to flasks containing 1.2 liters of diluted rumen fluid (240 ml
of rumen fluid plus 960 ml of buffer solution made according to Tilly and Terry
1963). Rumen fluid was collected from a newly slaughtered buffalo in the village
abattoir into an insulated flask and used immediately or within 30 min of
sampling. The buffalo had been grazing local grasses and had been fasted
overnight.
The substrate was put in the incubation flask containing the diluted rumen fluid
which was then gassed with carbon dioxide and the flasks were incubated at 38
0C in a water bath for 24 and 48 hours.
Data
collection and measurements
The gas volume was read from the collection bottles
directly after 24 and 48 hours and the percentage of methane in the gas
was measured using a Crowcon infra-red analyser (Crowcon Instruments Ltd, UK)
for the separate incubations. Gas from the collection bottle was drawn into
the measuring apparatus. Three samples were
measured from each collection bottle.
At the end of each incubation time the residual
insoluble substrate in the incubation bottle was determined by filtering the
contents through several layers of cloth that
retained particle sizes to at least 0.1mm and then this was dried (100°C for 24
hours) and weighed.
The data were analyzed by the General Linear Model (GLM)
option in the ANOVA program of the Minitab (2000) Software. Sources of variation
in the model were: Biochar, NPN source, interaction Biochar*NPN and error.
Experiment 2
The objectives were to examine the effect of the concentration of biochar in the
fermentation medium over the range of 0 to 5% (DM basis).
The design was a 2*6 factorial with three replications. The factors were:
-
Washed or unwashed biochar
-
Concentration of biochar (0, 1, 2, 3, 4 or 5% on DM basis)
The general procedure and analyses were similar to those in experiment 1.
Biochar was used either as an untreated powder or after washing. Biochar was
washed by adding 100ml of distilled water to 50g of biochar, stirring and the
flask allowed to stand for 10 minutes before pouring off the water phase. This
was repeated two times and the biochar dried before adding to the
incubation flasks containing buffer, rumen fluid and substrate.
Statistical analysis
The data were analyzed by the General Linear Model (GLM)
option in the ANOVA program of the Minitab (2000) Software. Two sets of data
were analysed. The first set included all the data to test effect of levels of biochar.
The sources of variation were: levels of biochar and error.
In the second set the data for the control treatment were omitted so as to test
the effect of washing or not washing the biochar. Sources of variation in the
model for set 2 were: Level of biochar, washed or not washed, interaction level of biochar*washing
and error.
Experiment 3
Objectives and experimental design
The objectives were to examine a lower concentration of biochar (0.5% in
substrate DM) and the interaction with different proportions of potassium
nitrate and urea as NPN source in diluted rumen fluid incubated with cassava
root meal as described above .
The design was a completely randomized comparison of:
-
No biochar with urea (2% in DM)
-
0.5% biochar with urea (2% in
DM)
-
1.0% biochar with urea(2% in DM)
-
1.0% biochar with 50% urea (1%
in DM) and 50% nitrate (3% in DM)
-
1.0% biochar with 100% nitrate
(6% nitrate in DM)
There
were 4 replicates of each treatment. The general procedure and analyses were
similar to those in experiment 1.
Statistical analysis
The data were analyzed by the General Linear Model (GLM)
option in the ANOVA program of the Minitab (2000) Software. Sources of variation
in the model were: Treatments and error.
Results
Experiment 1
Effects of NPN source
Gas production, methane percentage in the gas, substrate solubilized and methane
produced per unit substrate solubilized were all lowered when nitrate replaced
urea as the fermentable nitrogen source at either 24 or 48hrs of the incubation
(Table 1; Figures 1 to 4). These results are similar to those reported by
Guo et al (2009) and Lin et al (2011), and in the many studies from the MEKARN
project (http://www.mekarn.org)
(Binh Phuong et al 2011; Inthapanya et al 2011; Outhen et al 2011; Phuong et al
2012a,b; Quang Do et al 2011; Silivong et al 2012; Sophea Iv and Preston T R
2011 ; Thanh et al 2011, 2012).
Effects of Biochar
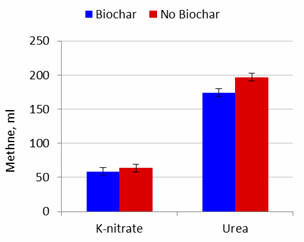
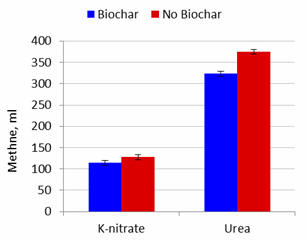
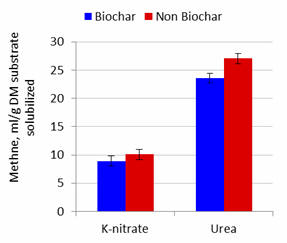
Addition of biochar did not affect gas production but increased the percentage
DM solubilized. Methane produced and methane produced per unit substrate
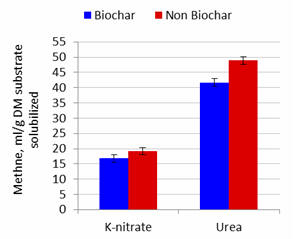
solubilized were lowered by added biochar by 11.5 and 12.8% at 24 and 48h when urea was the NPN source
but appeared to be less affected (interactions were P=0.16 and P=0.23 at 24h and
P=0.052 and P=0.069 at 48h) when nitrate was the source of NPN (8.3
and 11.5%; Figures 1 to 4). These effects (for lowering of methane production)
were thus similar for incubation periods
of 24 and 48 h with urea, but more pronounced for the longer period of fermentation (Table
2).
|
Table 2.
Mean values of gas
production, methane percentage in the gas, DM solubilized and
methane production per unit substrate solubilized after 24 or 48 h
of fermentation, in in vitro fermentation of cassava root meal
supplemented with potassium nitrate or urea,and with or without
addition of biochar (gas
production has been corrected for the carbon dioxide that would be
released when the urea was hydrolyzed) |
|
|
Biochar |
No Biochar |
Prob. |
K-nitrate |
Urea |
SEM |
Prob. |
P (B*NPN) |
|
0-24 hours |
|
|
|
|
|
|
|
|
|
Gas
production, ml
Total |
1206 |
1171 |
0.368 |
878 |
1500 |
26.43 |
<0.001 |
0.794 |
|
Corrected# |
1148 |
1113 |
0.368 |
878 |
1384 |
26.43 |
<0.001 |
0.794 |
|
Methane, % |
9.00 |
10.4 |
<0.001 |
7.00 |
12.4 |
0.198 |
<0.001 |
0.205 |
|
Methane, ml |
117 |
130 |
0.033 |
61.3 |
186 |
4.103 |
<0.001 |
0.161 |
|
Digested, % |
60.5 |
59.0 |
0.037 |
57.1 |
62.5 |
0.451 |
<0.001 |
0.489 |
|
Methane, ml/g DM substrate |
16.3 |
18.6 |
0.024 |
9.51 |
25.3 |
0.635 |
<0.001 |
0.226 |
|
0-48 hours |
|
|
|
|
|
|
|
|
|
Gas
production, ml |
|
|
|
|
|
|
|
|
|
Total |
1625 |
1669 |
0.343 |
1469 |
1825 |
31.35 |
<0.001 |
0.229 |
|
Corrected# |
1567 |
1611 |
0.343 |
1469 |
1707 |
31.35 |
<0.001 |
0.229 |
|
Methane, % |
13.0 |
14.4 |
0.019 |
8.25 |
19.1 |
0.357 |
<0.001 |
0.472 |
|
Methane, ml |
219 |
251 |
0.003 |
121 |
349 |
6.287 |
<0.001 |
0.052 |
|
Digested, % |
63.1 |
62.2 |
0.035 |
59.7 |
65.6 |
0.276 |
<0.001 |
0.471 |
|
Methane, ml/g DM substrate |
29.2 |
34.0 |
0.002 |
18.0 |
45.3 |
0.856 |
<0.001 |
0.069 |
|
# Corrected by subtracting CO2 derived from urea |
|
 |
 |
|
Figure 1.
Effect of biochar and potassium
nitrate or urea as NPN source on methane production after 24 hours
of fermentation |
Figure 2.
Effect of biochar and potassium
nitrate or urea as NPN source on methane production after 48 hours
of fermentation |
|
|
Figure 3.
Effect of
biochar and potassium nitrate or urea as NPN source on methane
production per unit of substrate DM solubilized after 24 hours of
fermentation
|
Figure 4.
Effect of
biochar and potassium nitrate or urea as NPN source on methane
production per unit substrate DM solubilized after 48 hours of
fermentation
|
Experiment 2
Effects of
level of biochar
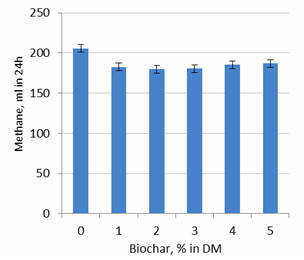
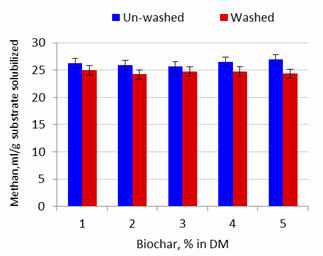
Methane produced in 24h was reduced by adding 1% biochar (by 12%) but there was
no further effects from raising biochar level to between 2 and 5% (Table 3;
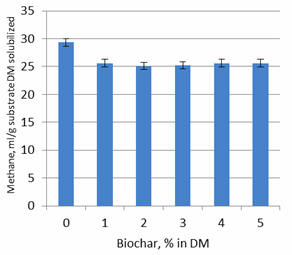
Figure 5). The same effect was observed when methane production was expressed as
ml per unit substrate DM solubilized (Figure 7).
Effect of washing the biochar
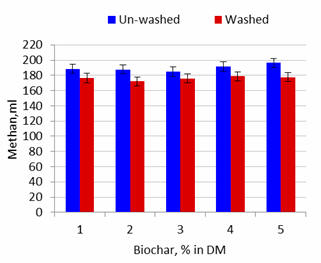
Methane production in 24h and per unit substrate DM solubilized was reduced by
about 5% by washing the biochar (Table 3; Figures 6 and 8).
|
Table 3.
Mean values of gas
production, methane percentage, substrate DM solubilized and methane
per unit substrate solubilized |
|
|
|
|
|
Level of biochar |
|
|
|
Washed |
Unwashed |
Prob. |
0 |
1 |
2 |
3 |
4 |
5 |
SEM |
Prob. |
P (B*NPN) |
|
Gas production, ml |
|
|
|
|
|
|
|
|
|
|
|
Total |
1479 |
1522 |
0.015 |
1453 |
1442 |
1458 |
1483 |
1567 |
1600 |
20.23 |
<0.001 |
0.924 |
|
Corrected# |
1306 |
1363 |
0.015 |
1337 |
1326 |
1342 |
1367 |
1451 |
1484 |
20..23 |
0.001 |
0.924 |
|
Methane, % |
12.3 |
12.7 |
0.055 |
14.2 |
12.7 |
12.3 |
12.2 |
11.8 |
11.7 |
0.236 |
<0.001 |
0.641 |
|
Methane, ml |
181 |
192 |
0.004 |
206 |
183 |
180 |
181 |
185 |
187 |
4.296 |
0.003 |
0.678 |
|
Digested, % |
60.7 |
61.3 |
0.141 |
59.7 |
60.6 |
60.9 |
60.9 |
61.6 |
62.1 |
0.464 |
0.026 |
0.914 |
|
Methane, ml/g DM
solubilized |
25.4 |
26.7 |
0.019 |
29.3 |
25.6 |
25.1 |
25.2 |
25.6 |
25.6 |
0.623 |
0.001 |
0.597 |
|
#corrected for CO2
produced from urea |
|
 |
 |
|
Figure 5.
Effect of level of biochar on methane production after 24
hours of fermentation |
Figure 6.
Effect of washing the biochar on methane production after 24 hours
of fermentation |
|
 |
 |
|
Figure 7.
Effect of level of biochar on methane production per unit of
substrate DM solubilized after 24 hours of fermentation |
Figure 8.
Effect of washing the biochar on methane production per unit
of substrate DM solubilized after 24 hours of fermentation
|
Experiment 3
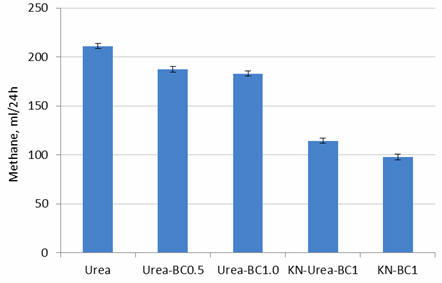
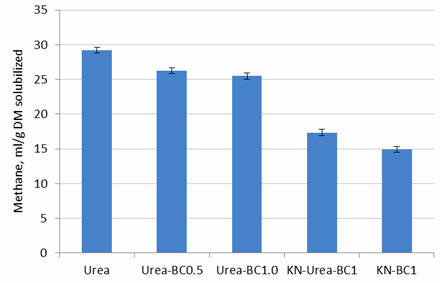
Biochar at 0.5% of the substrate reduced methane by 10% and at 1% reduced it by
12.7% (Table 4; Figures 9 and 10). With a 50% mix of nitrate and urea N,
plus biochar at 1%, the reduction in methane was 40.5% and with 100% nitrate N
plus biochar at 1%, it was 49%.
|
Table 4.
Mean values of gas
production, methane percentage, substrate DM solubilized and methane per
unit substrate solubilized for additions of biochar of 0 (BC0-U), 0.5%
(BC0.5-U), and 1.% (BC1-U) and biochar at 1% with 3% nitrate:1%
urea (BC1-KN3) or 6% nitrate (BC1-KN6) |
|
|
BC1-KN6 |
BC1-KN3 |
BC0-U |
BC0.5-U |
BC1-U |
SEM |
P |
|
Gas, ml |
1400b |
1388b |
1538a |
1500a |
1525a |
20.0 |
<0.001 |
|
Methane, % |
7.0d |
8.25c |
13.8a |
12.5b |
12.0b |
0.22 |
<0.001 |
|
Methane, ml |
98d |
115c |
211a |
187b |
183b |
2.78 |
<0.001 |
|
Digested, % |
58.2b |
59.1b |
61.5a |
60.6a |
61.1a |
0.28 |
<0.001 |
|
Methane, ml/DM solubilized |
14.9d |
17.4c |
29.2a |
26.3b |
25.5b |
0.43 |
<0.001 |
|
abcd Means without
common superscript are different at P<0.05 |
|
 |
|
Figure 9.
Effect of level of biochar (0, 0.5 or 1%) with urea or 1%
biochar with combinations of urea and nitrate, on methane
production after 24 hours of fermentation |
|
 |
|
Figure 10.
Effect of level of biochar (0, 0.5 or 1%) with urea, or 1% biochar
with combinations of urea and nitrate, on methane production
per unit DM solubilized after 24 hours of fermentation |
Discussion
As has been observed in numerous studies nitrate lowers methane production from
rumen fluid indicating the presence of nitrate reducing bacteria that use
nitrate as a terminal electron acceptor and outcompete methanogens for hydrogen
produced in fermentation. However this is the first study to show that biochar
may also have a role in reducing rumen methanogenesis. Adding 5% biochar to the
substrate used in the incubation flasks apparently lowered net methane production by
14% and by 13% when this was calculated on an, as is or, per unit of dry matter
apparently fermented basis, respectively. In the presence of nitrate there was a
significant reduction of methane production by 34 %. The presence of biochar
appeared to further lower methane production in the presence of nitrate but the
lowered production was quantitatively small but still 9% of the methane produced
when nitrate was incubated without biochar.
In the second study increasing levels of biochar added to the incubation medium
demonstrated that the optimum biochar level for maximum mitigation in vitro
was
less than 1% of the substrate added. Even though the major reduction in
methane production by biochar was similar to that in the first study, at every
level of inclusion of unwashed biochar in the incubation medium there was both a
higher total methane production and methane production per unit of
substrate apparently digested.So washing the biochar appears to increase it’s
methane mitigating benefits.Biochar’s overall mechanism for lowering methane
production appeared to be mostly associated with its insoluble components.
This research was initiated because of the demonstration that biochar may
encourage methanotrophic microbes to proliferate in anoxic soils associated with
rice growing (Feng et al 2012). However it is recognized that biochar does not
always decrease methane release from amended soils (Cai et al 1997) and there
are multiple interactions that come into play in any anoxic ecosystem that may
affect the results. Similarly it will be necessary to study different biochars
with differing sources of rumen fluid to clarify the potential mitigation
possibilities for enteric methane.
It appears unlikely that biochar lowers methane production by anaerobic
oxidation as in natural anaerobic environments methanotrophs grow slowly
limited by the energy availability. The short turn over rate of rumen fluid
appears to negate
the substantial growth of these organisms. However methanotrophs depend on methane
oxidation and they are also sulphur-reducing bacteria (SRB) because
sulphur is the terminal electron acceptor in anaerobic methane oxidation
according to the equation CH4+SO42− ->HCO3−
+HS−+H2O. Other studies have suggested that SRB did not
carry out anaerobic oxidation directly, but rather a consortium with unknown
organisms and SRB was involved (Smemo and Yavitt 2011). However, it appears
that anaerobic methanotrophs are present in rumen fluid (Stock and
McCleskey 1964; Kajikawa et al 2003)
and aerobic methanotrophs are attached to rumen epithelium (Mitsumori
et al 2002). To be effective in capturing methane, anaerobic methanotrophs would
have to be spatially distributed close to the site of methane production which
is likely to be close to the methanogenic Archae that probably colonize
the outer layers of the biofilm consortia attached to feed particles (McAllister
and Cheng
1996; Leng 2011) where the partial pressure of methane will be the highest.
The spatial distribution of organisms relative to their preferred substrate is
important as illustrated in in vitro incubations of marine
sediments containing high numbers of microbial consortia, consisting of
organisms that affiliate with methanogenic archaea and with sulphate-reducing
bacteria, where an increase in partial pressure of the methane from 0.1 MPa
(approximately 1 atm) to 1.1 MPa (approximately 11 atm) resulted in a four to
fivefold increase of the sulphide production rate and therefore methane
oxidation (Nauhaus
et al 2002), Thus the spatial distribution of methane oxidizing
organisms or consortia close to the site of methanogenesis appears to be a
critical issue in stimulating the overall reactions. The question raised here
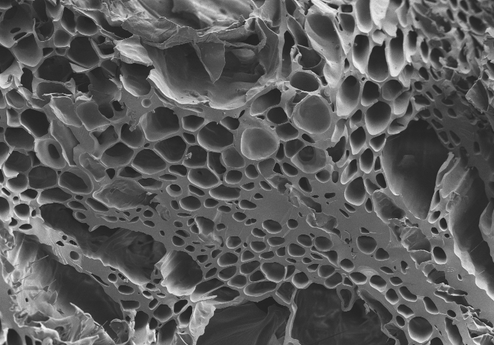
is “does biochar with its relatively large surface area (http://en.wikipedia.org/wiki/BET_theory)
and highly porous structure (Photo 1) provide
a
favourable habitat for the organisms involved in a methanogenic
methanotrophic interaction increasing the potential for anaerobic methane
oxidation”. This then leads to ecological studies of how best to increase
the efficiency of these associations. The BET surface area is a measure of the
ability of a material to absorb gases. Biochars often have BET surface areas of
2-4 m2 /g biochar but much greater surface areas maybe produced by
particular production technologies. As shown in the photo the potential to
create habitat for biofilm residing microbes is substantial where gases could be
adsorbed on to the surfaces of the biochar.
There are also other potential explanations for the net decrease in methane release
from rumen fluid including a change in surface
ion exchange capacity for microbial biofilm
formation or a direct effect of chemicals not soluble in water on fermentation
pathways and the end products produced. A direct toxic effect on methanogens
seems unlikely as the rate of fermentation of the substrate appeared to be
unchanged by biochar addition and the amounts of biochar were exceedingly small.
It is also unlikely that the biochar washed or unwashed could supply high
affinity electron accepting substrate, particularly at the lowest level of
inclusion (1% of the total substrate). However hydrogen uptake could be reduced
in some way as nitrate out-competes most other electron acceptors (sulphate and
carbon dioxide) and the effect of biochar appears to be reduced when nitrate
replaced urea as the major fermentable N source. Nitrate appears to inhibit
anaerobic methane oxidation (Hanson and Hanson 1996). Since the depression in
methane production was observed in vitro there can be no involvement of the
rumen wall associated methanotrophs, which are probably aerobic bacteria
dependant on diffusion of oxygen across the rumen epithelium as the terminal
electron acceptor (Mitsumori et al 2002).
The lack of, or small, response of methane production to biochar inclusion in the substrate
when nitrate provided the fermentable N source may be a result of nitrate
inhibition of methanotrophs through competition with these sulphur reducing bacteria
for available electrons.
The preliminary and speculative nature of the present report is acknowledged but
the importance of this observation to atmospheric methane accumulation if
repeatable in other situations is so immense that bringing the finding to
the attention of other research scientists is warranted and this early
publication is to put the information in the public domain as it is felt that
any attempt to patent a process using biochar to mitigate enteric methane
production from all animals is not in the interests of people in general. If these
results are
repeated when animals are fed biochar in their diet, then there would be
good reason to suggest that enteric methane production maybe lowered from all
animals including humans by extremely small amounts of dietary biochar whether
fermentation sacs precede or follow digestion in the intestines. The exception
will be where acetogenesis replaces methanogenesis in the fermentation areas of
the tract as in the kangaroo that produce little methane (Kempton et al 1976). A major point here is that if the results are applicable to animals under
domesticated conditions the small amounts likely to be needed would probably
indicate this could be the least expensive methodology for mitigating
methane production.
Conclusions
-
Methane production by rumen fluid was decreased when nitrate
replaced urea as NPN source at both 24 and 48 h of fermentation time.
-
There was no effect of
added biochar on gas production but the percentage of DM solubilized
was increased.
-
Methane production and
methane per unit substrate solubilized was reduced by added biochar with
urea as NPN source
-
Overall, the methane production by rumen fluid was reduced by
12% by adding 1% of biochar and there were no further benefits from increasing biochar content .
-
Washing the biochar
appeared to improve its methane mitigation benefits.
-
With 3% KN and 1% urea, plus biochar at 1%, the reduction in
methane was 40.5% and with 6% KN plus biochar at 1%, it was 49%.
The authors acknowledge support for this research from the MEKARN project
financed by Sida. Special thanks to Mr Sengsouly Phongphanith who provided
valuable help in the laboratory and preparation of the samples. Thanks
also to the Department of Animal Science laboratory, Faculty of Agriculture and
Forest Resource, Souphanouvong University for providing the facilities to carry
out this research.
Binh Phuong L T, Preston T R and Leng R A
2011 Mitigating methane production
from ruminants; effect of supplementary sulphate and nitrate on methane
production in an in vitro incubation using sugar cane stalk and cassava leaf
meal as substrate. Livestock Research for Rural Development. Volume 23, Article
#22.
http://www.lrrd.org/lrrd23/2/phuo23022.htm
Cai Z C, Xing G X, Yan X Y,
Xu H, Tsuruta H, Yagi K and Minami K.
1997 Methane and nitrous oxide emissions from rice paddy fields as
affected by nitrogen fertilizers and water management. Plant Soil. 196, 7–14
Feng,Y Xu, Y Yu Y, Xie Z and
Lin Xi
2012
Mechanisms of biochar decreasing methane emission from Chinese paddy soils.
Journal of Soils Biology and Biochemistry 46, 80-88
Guo
W S, Schaefer, D M
Guo, X X, Ren L P and Meng Q X
2009 Use of
nitrate-nitrogen as a sole dietary nitrogen source to inhibit ruminant
methanogenesis and improve microbial nitrogen synthesis In vitro,
Asian-Australasian
Journal of Animal Science 22, 542-54
Hanson R S and Hanson T E 1996
Methanotrophic bacteria. Microbiological Reviews 60, 439 – 471.
Inthapanya S, Preston T R and Leng R A 2011
Mitigating methane production from ruminants; effect of calcium nitrate as
modifier of the fermentation in an in vitro incubation using cassava root as the
energy source and leaves of cassava or Mimosa pigra as source of protein.
Livestock Research for Rural Development. Volume 23, Article #21.
http://www.lrrd.org/lrrd23/2/sang23021.htm
Kajikawa H and Newbold C J 2000
Methane oxidation in the rumen. Journal of Animal Science, 78 (Suppl. 1), 291.
Kajikawa H, Valdes C, Hillman K,
Wallace R J and Newbold C J 2003
Methane oxidation and its coupled electron-sink reactions in ruminal fluid.
Letters in Applied Microbiology, 36: 354–357. doi: 10.1046/j.1472-765X.2003.01317.x
Kempton, T J, Murray R M and Leng R A 1976
Methane production and
digestibility measurements in the grey kangaroo
and sheep. Australian Journal of Biological
Sciences 29: 209-214.
Leng R A 2011
The Rumen: a fermentation vat or a series
of organized structured biofilm microbial consortia; implications for methane
mitigation strategies. Workshop on Reducing Greenhouse Gas Emissions from
Livestock and Soils (Editors: Reg Preston and Sisomphone Southavong). National
Institute of Animal Science, Hanoi, 14-15 November 2011.
httm://www.mekarn.org/workshops/GHG-CC/leng.htm
Leng R A
2008 The potential of feeding nitrate to reduce enteric methane
production in ruminants. A Report to The Departmernt of Climate Change
Commonwealth Government of Australia. ACT Canberra Australia For paper and PPT
presentation see
http://www.penambulbooks.com/Downloads/Leng-Final%20Modified%20%2017-9-2008.pdf.
Liu Y X, Yang M, Wu Y M,
Wang H L, Chen Y X and Wu W X 2011
Reducing CH4 and CO2 emissions from waterlogged paddy soil with biochar. Journal
of Soils and Sediments 11, 930-939
Lin M, Schaefer D M, Guo W
S, Ren L P and Meng Q X 2011
Comparisons of In vitro Nitrate Reduction, Methanogenesis, and
Fermentation Acid Profile among Rumen Bacterial,Protozoal and Fungal Fractions.
Asian-Australasian Journal of Animal Science 24, No. 4 : 471 - 478
McAllister T A and Cheng K J 1996 Microbial
strategies in the ruminal digestion of cereal grains. Animal Feed Science and
Technology 62: 29–36
Minitab 2000
Minitab Software Release 13.2
Mitsumori M, Ajisaka N, Tajima K, Kajikawa H and Kurihara M
2002 Detection of Proteobacteria from the rumen by PCR using methanotroph-specific
primers. Letters in Applied Microbiology. 35(3):251-5.
Nauhaus K, Boetius A, Kruger M and Widdel F 2002
In vitro demonstration of anaerobic oxidation of methane coupled to sulphate
reduction in sediment from a marine gas hydratearea. Environmental Microbiology
4: 296–305.
Olivier P 2010 The
Small-Scale Production of Food, Fuel, Feed and Fertilizer; a Strategy for the
Sustainable Management of Biodegradable Waste.
http://www.mekarn.org/workshops/pakse/html/olivier.docx
Outhen P, Preston T R and Leng R A 2011
Effect of supplementation with urea or calcium nitrate and cassava leaf meal or
fresh cassava leaf in an in vitro incubation using a basal substrate of sugar
cane stalk. Livestock Research for Rural Development. Volume 23, Article #23.
http://www.lrrd.org/lrrd23/2/outh23023.htm
Phuong L T B, Khang D N, Preston T R and
Leng R A 2012 Mitigating
methane emissions from ruminants; comparison of three nitrate salts as sources
of NPN (and sinks for hydrogen) in an in vitro system using molasses and cassava
leaf meal as substrates. Livestock Research for Rural Development. Volume 24,
Article #17.
http://www.lrrd.org/lrrd24/1/phuo24017.htm
Phuong L T B, Khang D N, Preston T R and
Leng R A 2012 Mitigating
methane production from ruminants; effect of supplementary sulphate and nitrate
on methane production in an in vitro incubation using molasses and cassava leaf
meal as substrate. Livestock Research for Rural Development. Volume 24, Article
#18.
http://www.lrrd.org/lrrd24/1/phuo24018.htm
Quang Do H, Thi Thuy T, Phuc Hao T, Preston T
R and Leng R A 2011 Effects of
nitrate and sulphur on in vitro methane production and dry matter degradation.
Livestock Research for Rural Development. Volume 23, Article #211.
http://www.lrrd.org/lrrd23/10/hqdo23211.htm
Silivong P, Preston T R and Man N V 2012
Effect of supplements of potassium nitrate or urea as sources of NPN on methane
production in an in vitro system using molasses and Paper mulberry or Muntingia
foliages as the substrate. Livestock Research for Rural Development. Volume 24,
Article #69.
http://www.lrrd.org/lrrd24/4/sili24069.htm
Smemo K A and Yavitt J B 2011
Anaerobic oxidation of methane: an underappreciated aspect of methane cycling in
peatland ecosystems? Biogeosciences, 8, 779–793,www.biogeosciences.net/8/779/2011/doi:10.5194/bg-8-779-2011
Sophea Iv and Preston T R 2011
Effect of different levels of supplementary potassium nitrate replacing urea on
growth rates and methane production in goats fed rice straw, mimosa foliage and
water spinach. Livestock Research for Rural Development. Volume 23, Article #71.
http://www.lrrd.org/lrrd23/4/soph23071.htm
Stocks P K and McCleskey C S 1964
Morphology and physiology of Methanomonas
methanooxidans. Journal of Bacteriology 88, 1071 – 1077
Thanh V D, Preston T R and Leng R A 2011:
Effect on methane production of supplementing a basal substrate of molasses and
cassava leaf meal with mangosteen peel (Garcinia mangostana) and urea or nitrate
in an in vitro incubation. Livestock Research for Rural Development. Volume 23,
Article #98.
http://www.lrrd.org/lrrd23/4/than23098.htm
Thanh V D, Thu N V and Preston T R 2012
Effect of potassium nitrate or urea as NPN source and levels of Mangosteen peel
on in vitro gas and methane production using molasses, Operculina turpethum and
Brachiaria mutica as substrate. Livestock Research for Rural Development. Volume
24, Article #63.
http://www.lrrd.org/lrrd24/4/thanh24063.htm
Tilley J M A and Terry R A 1963 A two
stage technique for the in vitro digestion of forage crops. Journal of the
British Grassland Society 18 : 104.
Trinh Phuc Hao, Ho Quang Do, Preston T R and Leng R A 2009
Nitrate as a fermentable nitrogen supplement for goats fed forage based diets
low in true protein. Livestock Research for Rural Development. Volume 21,
Article #10.
http://www.lrrd.org/lrrd21/1/trin21010.htm
Zhanga A, Cuia L, Pana G, Li
L, Hussaina Q, Zhanga X, Zhenga J and Crowley D 2010
Effect of biochar amendment on yield and methane and nitrous oxide emissions
from a rice paddy from Tai Lake plain, China. Agriculture, Ecosystems and
Environment 139 (2010) 469–475
Go
to top


