|
|
|
|
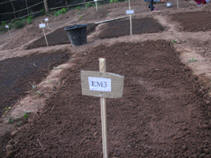
Photo 1. Land experiment |
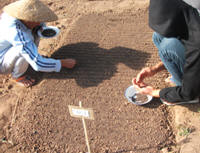
Photo 2. Planting of water spinach |
| Back to contents |
The experiment was carried out at farm of Souphanuovong University to evaluated changes in soil fertility to growth performance of water spinach. The experiment was arranged in a completely randomized block design with 08 treatments and 04 replications. The factors were: no fertilizer, biochar applied at 5% of the soil; biodigester effluent applied at 5gN/m2; microorganism applied at 5gN/m2; biochar combined with effluent; biochar combined with microorganism; saturation of the biochar with effluent and saturation of biochar with microorganism.
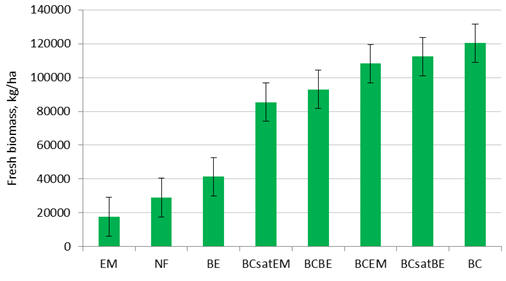
The fresh biomass yield of water spinach (over 35days period from planting) indicated applying the biochar alone was trended to increase compared with microorganism or effluent treatment. Biochar was improved the soil pH and water holding capacity in the soil on growth performance of water spinach.
Keywords: Fertilizer, gasifier stove, rice husk, soil pH, water holding capacity
It has been shown that the effect of biodigester effluent on growth of maize in a biotest was increased when it was applied together with biochar derived from sugar cane bagasse (Rodriguez et al 2009). Recently, it has been reported that biochar is very effective in adsorbing phosphate from polluted waste water (Bin Gao and Pratap Pullammanappa, 2011). It is known that biochar acts like activated charcoal in its capacity to adsorb a range of chemical compounds (Glaser 2007).
When livestock manure is processed in a biodigester the N-containing compounds are partially reduced to soluble ammonium salts (San Thy et al 2003). These are more readily available for plant assimilation but there is also the likelihood that the leaching of the N in the effluent will be increased when the N is present as soluble ammonium salts.
Hypothesis
The hypotheses to be tested are that:
· Applying biochar; biodigester effluent and microorganism (fertilizer) would enhance the impact of more efficient use of water spinach growth.
This experiment was conducted on farm of Souphanouvong University Luang Prabang, lao PDR. The experiment was lasted 02 month, from January to March, 2012.
The treatments applied as fertilizer to water spinach in a completely randomized block design (CRBD) arrangement with 08 treatments and 04 replications were:
NF: No fertilizer
BC: Biochar at 5% of the soil
BE: Biodigester effluent applied at 5 g N/m2
BCE: Biochar (5% of the soil) and effluent (at 5 g N/m2)
BCsatBE: Biochar (5% of soil) after saturation of the biochar with biodigester effluent
EM: Microorganism applied at 5 g N/m2
BCEM: Biochar (5% of the soil) and microorganism (at 5 g N/m2)
BCsatEM: Biochar (5% of soil) after saturation of the biochar with microorganism
|
Table1: Layout of experiment |
|||||
|
Rep I |
NF |
BEsatBC |
BE |
BC |
BC |
|
Rep II |
BEsatBC |
BCBE |
NF |
BCBE |
BCBE |
|
Rep III |
BE |
NF |
BEsatBC |
BE |
BC |
|
Rep IV |
BCBE |
BE |
BC |
NF |
BEsatBC |
Biochar was made in a gasifier stove (Olivier, 2010) using rice husks as the fuel. Effluent was taken from the biodigester installed in the experimental pig unit in Souphanouvong University. EM (Microorganism) was made from vegetable residual mixed molasses with ratio 3:1 and then putted in plastic container until 7-10days. The saturated biochar was prepared by immersing the biochar for 1 h in a container filled with biodigester effluent (10 kg biochar in 100 litres of effluent). The biochar was then be filtered to remove unabsorbed effluent and dried under shade for 24 h prior to be used in the experiment.
Weighed amounts of acid soil (pH 4 to 4.5) was putted in plots (1x2m and 15cm deep) and mixed with biochar and/or effluent and microorganism or not fertilized according to the treatments (Photo1). In BE the effluent was applied weekly in quantities of 10, 20, 30, 40% of the total N (50 kg N/ha) applied after, 5, 10, 15 and 25 days.
Seeds of water spinach were planted with 2cm spacing (same quantity per plots). All plots are irrigated daily (Photo2).
|
|
|
|
Photo 1. Land experiment |
Photo 2. Planting of water spinach |
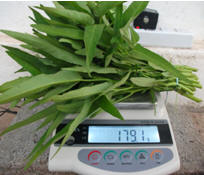
Height of the water spinach was measured weekly. After 35 days, the above ground biomass is harvested and weighed, then separated into leaf and stem to determine ratios of these components (Photo4). Samples of each was analyzed for DM (microwave radiation; Undersander et al 1993), total N AOAC (1990).
The pH of soil samples was determined using a digital pH meter. The water holding capacity was determined by weighing soil into a glass funnel fitted with filter paper and then saturating the soil with water. After 24 the soil was weighed to determine the quantity of water that had been retained. The water spinach is then observed during a regrowth period also of 35 days when the measurements are repeated.
|
|
|
|
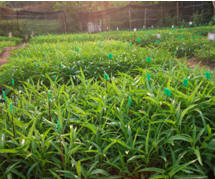
Photo 3. Growing of water spinach |
Photo 4. Weigh of water spinach |
Data was analyzed by Analysis of variance (ANOVA) using the General Linear Model (GLM) option of the Minitab software (Minitab release 13.3, 2000). Sources of variation are: Treatments and error.
The pH was higher for biochar stove than microorganism and effluent (Table 1). However, this value of DM, OM content of biochar stove was lower than reported of Southavong et al (2011) for biochar obtained from an updraft gasifier (94.3 of DM %, 35.6 % of OM) compared with this experiment.
|
Table 2: Chemical composition of experimental materials |
||||
|
Composition |
DM, % |
N, mg/liter |
OM, % in DM |
pH |
|
Soil |
89.5 |
- |
5.46 |
4.63 |
|
Biochar stove |
72.1 |
- |
31.5 |
10.2 |
|
Microorganism |
NA |
800 |
NA |
5.14 |
|
Effluent |
NA |
300 |
NA |
7.68 |
|
NA: Not analyzed |
||||
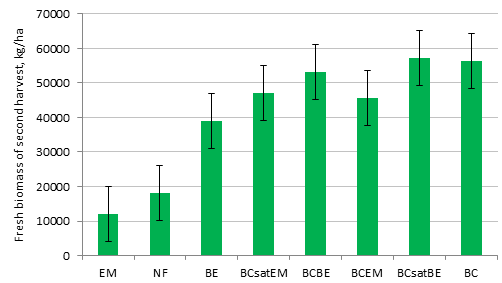
There were higher for leaves than stem of fresh biomass yield in biochar treatment compared with other treatments (Table 3). The entire of fresh biomass yield (1st and 2nd of harvest) was higher for biochar treatment than other treatments (microorganism; effluent; no fertilizer and combining EM or effluent with biochar) (Table 3, figures 1 and 2).
|
Table 3: Mean values for effects of biochar, micro-organism and effluent on biomass yield |
||||||||||
|
|
Height, cm |
No. of leaves |
Biomass yield 1st harvest, g/m2 |
Kg/ha |
Biomass yield 2nd harvest, g/m2 |
Kg/ha |
||||
|
|
Stem |
Leaves |
Total |
Stem |
Leaves |
Total |
||||
|
Biochar |
16.0 |
8.0 |
10458 |
13600 |
12029 |
120291 |
4950 |
6340 |
5645 |
56450 |
|
Effluent |
11.9 |
5.9 |
3310 |
4950 |
4130 |
41300 |
3485 |
4315 |
3900 |
39000 |
|
Microorganism |
8.52 |
4.8 |
1578 |
1970 |
1774 |
17741 |
1080 |
1340 |
1210 |
12100 |
|
No fertilizer |
10.2 |
5.4 |
2341 |
3460 |
2901 |
29006 |
1625 |
1980 |
1802 |
18025 |
|
BCEF |
15.1 |
7.3 |
7400 |
11185 |
9293 |
92925 |
4765 |
5880 |
5323 |
53225 |
|
BCsatEF |
16.8 |
7.8 |
9199 |
13275 |
11237 |
112372 |
4965 |
6485 |
5725 |
57250 |
|
BCEM |
15.5 |
7.1 |
9848 |
11800 |
10824 |
108237 |
4125 |
5020 |
4573 |
45725 |
|
BCsatEM |
14.8 |
7.1 |
7378 |
9715 |
8547 |
85466 |
4015 |
5425 |
4720 |
47200 |
|
SEM |
0.82 |
0.36 |
1091.1 |
1618.2 |
1139.9 |
11398.9 |
761 |
857.4 |
797.1 |
7971.3 |
|
Prob. |
<0.001 |
<0.001 |
<0.001 |
<0.001 |
<0.001 |
<0.001 |
0.07 |
0.02 |
0.03 |
0.03 |
|
BCEF: Biochar (5% of the soil) and effluent (at 5 g N/m2); BCsatEF: Biochar (5% of soil) after saturation of the biochar with effluent; BCEM: Biochar (5% of the soil) and microorganism (at 5 g N/m2); BCsatEM: Biochar (5% of soil) after saturation of the biochar with microorganism |
||||||||||
|
|
|
Figure 1. Effect of fresh biomass yield of water spinach (1st harvest) |
|
|
|
Figure 2. Effect of fresh biomass yield of second harvest of water spinach |
The increase in growth of the water spinach by applied the biochar is in agreement with the report of Rodríguez et al (2011) in which used of a culture of beneficial micro-organisms, biochar and biodigester effluent to improve the growth of maize in acid soil indicated biochar increased root development and yield of the above-ground biomass.
Effluent increased maize foliage growth by 70% and root weight by 100% compared with the control treatment (Rodríguez et al 2011).
The native micro-organism increased maize foliage growth three-fold and root development two-fold (Rodríguez et al 2011) and other result was indicated using the native micro-organism and bio-plant were not different of plant height, number of leaves and harvest yield, but when was supplied level of 3kg/m2 (equivalent with 30 tonnes/ha) of “NM” compost could be get the high yield (Hanh et al 2012 (un-public)). However, the biomass yield was lower for microorganism and effluent treatment in this experiment.
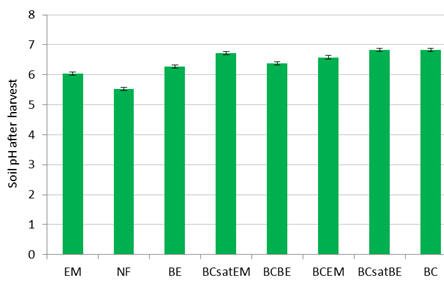
The pH of the soil was significantly increased when was applied the biochar; microorganism or effluent and combining EM or effluent with biochar. There were effects of improved the soil pH due to applied biochar and biochar combined with EM or effluent compared with EM, effluent alone or no fertilizer (Table 4; Figure 3). There is some emphases was made by pyrolysis of eucalyptus logs and contained only 0.3% of ash and there was increased in soil pH from 5.0 to 5.4 after applying 40g biochar per 1 kg of soil (Rondon et al 2007), much less than the increase 6.8 in this experiment, but there was similar reported of the results from Southavong et al 2012; Rodríguez et al 2009.
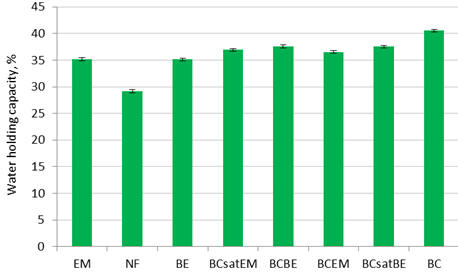
Applying biochar and biochar combined with EM or effluent were increased the water holding capacity of the soil compared with EM or effluent treatments (Table 4 and Figure 4).
|
Table 4: Mean values for effects of biochar, micro-organism and effluent on soil pH and water holding capacity |
||
|
|
Soil pH |
Water holding capacity, % |
|
Biochar |
6.8 |
40.5 |
|
Effluent |
6.3 |
35.1 |
|
Microorganism |
6.0 |
35.2 |
|
No fertilizer |
5.5 |
29.2 |
|
BCEF |
6.4 |
37.6 |
|
BCsatEF |
6.8 |
37.6 |
|
BCEM |
6.6 |
36.5 |
|
BCsatEM |
6.7 |
36.9 |
|
SEM |
0.06 |
0.26 |
|
Prob. |
<0.001 |
<0.001 |
|
BCEF: Biochar (5% of the soil) and effluent (at 5 g N/m2); BCsatEF: Biochar (5% of soil) after saturation of the biochar with effluent; BCEM: Biochar (5% of the soil) and microorganism (at 5 g N/m2); BCsatEM: Biochar (5% of soil) after saturation of the biochar with microorganism |
||
|
|
|
Figure 3. Effect of soil pH after harvest of water spinach |
|
|
|
Figure 4. Effect of water holding capacity after harvest of water spinach |
Application of biochar alone supported greater biomass yield of water spinach than application of biodigester effluent or inoculum of native micro-organisms.
There was no advantage in biomass yield of water spinach from combining biochar with biodigester effluent or inoculum of native micro-organisms.
Soil pH and water holding capacity in the soil were increased by biochar with no further benefit from combining biochar with biodigester effluent or inoculum of native micro-organisms.
The senior author expresses his gratitude to the MEKARN program financed by the Sida-SAREC Project for providing the opportunity and the budget to do the research. Thanks are also given to Souphanouvong University, Faculty of Agriculture and Forest Resource for providing infrastructure support and laboratory assistance.
AOAC 1990 Official methods of
analysis 15th ed. AOAC,
Washington, D.CBin
Gao and Pratap Pullammanappa 2011
UF researchers develop method to remove phosphate from water, using biochar.
Universityof Florida. Journal
Bioresource Technology.
(Downloaded press release from Internet)
Glaser B 2007 Prehistorically modified soils of central Amazonia: a model for sustainable agriculture in the twenty-first century. Phil. Trans. R. Soc. B (2007) 362, 187–196
Minitab 2000 Minitab Software Release 13
Olivier P 2010 The Small-Scale Production of Food, Fuel, Feed and Fertilizer; a Strategy for the Sustainable Management of Biodegradable Waste. http://www.mekarn.org/workshops/pakse/html/olivier.docx
Rodríguez L, Salazar P and Preston T R 2009 Effect of biochar and biodigester effluent on growth of maize in acid soils. Livestock Research for Rural Development. Volume 21, Article #110. http://www.lrrd.org/lrrd21/7 /rodr21110.htm
Rodríguez L, Salazar P and Preston T R 2009 Effect of biochar and biodigester effluent on growth of maize in acid soils. Livestock Research for Rural Development. Volume 21, Article #110 http://www.lrrd.org/lrrd21/7/rodr21110.htm
Rodríguez L, Salazar P and Preston T R 2011 Effect of a culture of “native” micro-organisms, biochar and biodigester effluent on the growth of maize in acid soils. Livestock Research for Rural Development. Volume 23, Article #223. Retrieved June 3, 2012, from http://www.lrrd.org/lrrd23/10/rodr23223.htm
Rondon M A, Lehmann J, Ramírez J and Hurtado M 2007 Biological nitrogen fixation by common beans (Phaseolus vulgaris L.) increases with bio-char additions’. Biology and Fertility of Soils. Volume 43, No 6. http://www.css.cornell.edu/faculty/lehmann/publ/BiolFertSoils%202006,%20online%20first,%20Rondon.pdf
San Thy, Preston T R and Ly J 2003 Effect of retention time on gas production and fertilizer value of biodigester effluent. Livestock Research for Rural Development 15 (7). http://www.lrrd.org/lrrd15/7/sant157.htm
Sisomphone Southavong, Preston T R and Ngo Van Man 2012a Effect of soil amender (biochar or charcoal) and biodigester effluent on growth of water spinach. Livestock Research for Rural Development. Volume 24, Article #026. Retrieved, from http://www.lrrd.org/lrrd24/02/siso24026.htm
Southavong S and Preston T R 2011 Growth of rice in acid soils amended with biochar from gasifier or TLUD stove, derived from rice husks, with or without biodigester effluent. Livestock Research for Rural Development. Volume 23, Article #32. http://www.lrrd.org/lrrd23/2/siso23032.htm
Undersander D, Mertens D R and Theix N 1993 Forage analysis procedures. National Forage Testing. Association. Omaha pp 154.