Reducing Greenhouse Gas Emissions from Livestock and Soils |
Leaves from Taro (Colocacia esculenta) and Duckweed (Lemna spp) were compared as supplements for Tilapia (Oreochromis niloticus) grown in open ponds fertilized with biodigester effluent or not fertilized. The design was a 3*2 factorial arrangement with 3 replications. Fresh duckweed (Lemna minor) was grown in adjacent ponds fertilized with biodigester effluent. Taro leaves (Colocacia esculenta) were harvested from natural stands in the Centre. Both supplements were given at between 3 and 5% of the fish live weight (DM basis). The Tilapia had an average starting weight of 2.52 g and length 5 cm. The density was 5 fish/m2. The 18 ponds were each 3*2m and 1 m depth. The biodigester effluent was taken from a tubular polyethylene plug-flow biodigester charged with pig manure. The quantity applied was 520 mg N/pond/day.
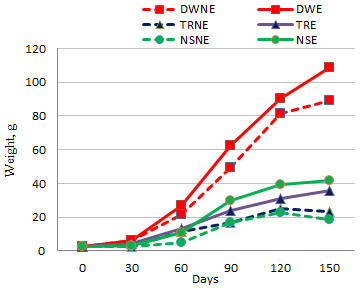
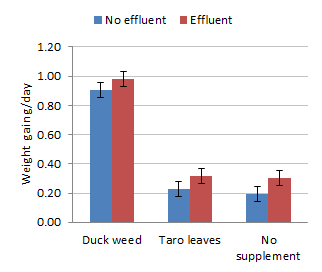
Growth rates were highest for Tilapia supplemented with duckweed and in ponds fertilized with biodigester effluent (Figures 1 and 2) There were no benefits from feeding Taro leaves. Survival was high on all treatments (98-99%). Values for pH, ammonia and nitrous dioxide were higher in ponds fertilized with biodigester effluent (Table 1).
Table 1. Mean values for water quality in ponds fertilized with effluent and supplemented with duckweed, taro leaves or nothing |
|||||||||
Duckweed |
Taro leaves |
No supp. |
SEM |
P |
No effluent |
Effluent |
SEM |
P |
|
Growth and feed conversion | |||||||||
Growth rate, g/d | 0.927 | 0.255 | 0.232 | 0.036 | <0.001 | 0.425 | 0.518 | 0.0295 | 0.047 |
Supp. DMI | 0.742 | 0.197 | @ | 0.016 | <0.001 | 0.473 | 0.466 | 0.016 | 0.76 |
DM conversion | 0.818 | 0.869 | 0.92 | 0.746 | |||||
DM conversion# | 1.06 | 5.63 | |||||||
Water quality | |||||||||
pH |
6.45 |
6.15 |
6.28 |
0.104 |
0.13 |
5.98 |
6.6 |
0.0849 |
0.001 |
NH3, mg/litre |
0.0195 |
0.0195 |
0.0195 |
0.0195 |
0.168 |
0.0433 |
0.1933 |
0.0144 |
0.001 |
NO2, mg/litre |
0.035 |
0.01 |
0.025 |
0.0157 |
0.27 |
0.00833 |
0.0383 |
0.0128 |
0.1 |
@ Not supplemennted; #Conversion rate after subtracting the LWG supported by the natural feed (eg: the LWG on the unsupplemented treatment) |
0.7458 |
0.9223 |
0.10322 |
Figure 1. Growth curves of Tilapia raised in open ponds fertilized with biodigester effluent (E) or no fertilizer (NE), and supplemented with duckweed (DW), Taro leaves (TR) or not supplemented (NS) | Figure 2. Mean values for weight gain of Tilapia in open ponds fertilized with biodigester effluent or no fertilizer, and supplemented with duckweed, Taro leaves or not supplemented |
No supplememt |
Taro leaves |
Duckweed |
SEM |
P |
||
Live weight, g |
||||||
Initial |
||||||
Final |
||||||
Weight gain, g/d |
0.19 |
0.23 |
0.91 |
0.04 |
||
Length gain, cm/d |
||||||
DMI |
0 |
0.197 |
0.742 |
0.016 |
<0.001 |
|
FCR |
||||||
FCR |
0.869 |
0.818 |
||||
FCR# |
5.63 |
1.06 |