 |
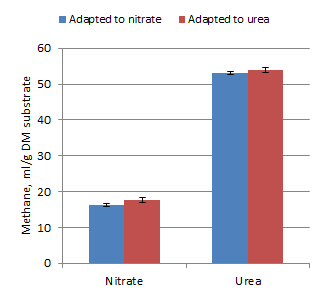
| Figure 1. Methane reduction in an in vitro system with rumen fluid inoculum from rumen-fistulated cattle adapted to nitrate or to urea for 3 weeks prior to taking the rumen fluid |
|
Reducing Greenhouse Gas Emissions from Livestock and Soils |
Abstract
The aim of this study was including two experiments with these objectives is to determine the effects of sources of rumen fluid one from urea fed animal and one from nitrate fed animal.
Experiment 1: An in vitro incubation system was used to evaluate the following treatments a completely randomized design with 2*2 factorial arrangements with three replications of the following treatments were: PM-U: Peanut meal and urea, FM-U: Fish meal and urea, PM-N: Peanut meal and NaNO3, FM-N: Fish meal and NaNO3 with Basal substrate is cassava root meal. The quantity of substrate was used in 2 g to which added 40 ml rumen fluids (from fistula cattle fed nitrate, nitrate percent in diet increased from 0 % nitrate to 6.2 % nitrate in 3 weeks) and 160 ml buffer solution. The incubation was 24 hour with measurements of total gas production, percent methane, dry matter degradation, ammoniac at 3 hours and 24 hours incubation. The total gas Production was not different statistic between urea and nitrate treatments (P=0.17); However, Percent methane of nitrate treatment was lower than to compare with urea treatment (P=0.02), specially, content of ammoniac of nitrate treatment was higher than to compare with urea treatment at 24 hours incubation (P=0.01) and similarly Dm degradation of nitrate treatment was higher than to compare with urea treatment (P=0.01).
Experiment 2: An in vitro incubation system was used to evaluate the following treatments a completely randomized design with 2*2 factorial arrangements with three replications of the following treatments were: PM-U: Peanut meal and urea, FM-U: Fish meal and urea, PM-N: Peanut meal and NaNO3, FM-N: Fish meal and NaNO3 with Basal substrate is cassava root meal. The quantity of substrate was used in 2 g to which added 40 ml rumen fluids (from fistula cattle fed urea at 2.3 % DM in diet) and 160 ml buffer solution. The incubation was 24 hour with measurements of total gas production, Percent methane, dry matter degradation, ammoniac at 3 hours and 24 hours incubation. The total gas Production was different statistic between urea and nitrate (P=0.001); However, content of ammoniac was not significant statistic between nitrate and urea treatments at 24 hours incubation (P= 0.75). The total gas production of peanut treatment was significant statistic with fish meal treatment (P=0.016), and similarly, there were the same trend for percent methane (P=0.039), dry matter degradation (P=0.001), ammoniac at 3 hours and 24 hours (P=0.001; P = 0.003).
Key words: Incubation, gas Production, fish meal, peanut meal, urea, nitrate.
| Table 1. Mean values for methane production and ammonia in an in vitro system using rumen fluid from cattle adapted to nitrate or to urea | ||||||
|
|
Gas, ml |
% CH4 |
CH4, ml/g DDM |
NH3 3h |
NH3 24h |
DMD, % |
|
Adapted to nitrate |
181 |
17.8 |
34.7 |
110 |
87.8 |
52.0 |
|
Adapted to urea |
184 |
18.2 |
35.9 |
109 |
84.1 |
50.5 |
|
P |
0.17 |
0.02 |
0.07 |
0.20 |
0.00 |
0.0 |
|
Nitrate |
128 |
13.4 |
17.1 |
110 |
86.1 |
51.8 |
|
Urea |
237 |
22.6 |
53.5 |
109 |
85.8 |
50.8 |
|
P |
<0.001 |
<0.001 |
<0.001 |
0.71 |
0.75 |
0.0 |
|
Fish meal |
180 |
17.8 |
34.3 |
98.9 |
84.2 |
48.8 |
|
Peanut meal |
185 |
18.2 |
36.3 |
120 |
87.7 |
53.7 |
|
P |
0.016 |
0.039 |
0.005 |
<0.001 |
0.003 |
<0.001 |
|
SEM |
1.46 |
0.11 |
0.43 |
0.63 |
0.74 |
0.28 |
 |
| Figure 1. Methane reduction in an in vitro system with rumen fluid inoculum from rumen-fistulated cattle adapted to nitrate or to urea for 3 weeks prior to taking the rumen fluid |