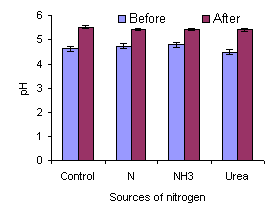
Figure 1. Effect of different
sources of fertilizer on soil pH before and after growing of water spinach
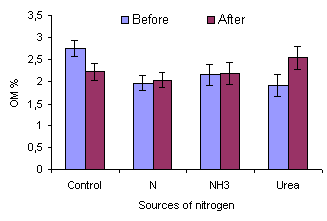
Figure 2. Effect of different sources of fertilizer on soil
organic matter before and after growing of water spinach
Two experiments were carried out from 22
July to 21 October 2001 in the University of Tropical Agriculture farm on the
campus of the Royal University of Agriculture, Phnom Penh.
The main objective
was to measure the effect of different sources of fertilizer and the response
in yield of water spinach (Ipomoea
aquatica, var. reptans) to increasing levels of effluent from a biodigester
charged with pig manure. In both
studies the first fertilizer application was made one week after planting and
the rest at weekly interval for 3 weeks. The total period from planting to
harvest was 4 weeks.
The first experiment was conducted to
evaluate the effect of different fertilizing practices on water spinach (Ipomoea
aquatica, var. reptans) yield. The crop was located on a sandy, poor soil derived from
alluvial deposits (pH 5.45, N 0.13%). A completely randomized block design with
four treatments was employed: no fertilization (control), 75 kg N/ha as urea,
75 kg total N/ha as biodigester effluent and 75 kg ammonia-N/ha as biodigester
effluent. There was no difference in fresh biomass yield of water spinach
between the two treatments with biodigester effluent (17.6 and 18.6 tonnes/ha,
for total-N and ammonia-N, respectively), which were higher than the control
(5.6 tonnes/ha) and tended to be higher than when the N source was from urea
(15.5 tonnes/ha).
In the second experiment the yield of water spinach was used as response
criterion to different levels of N (0, 20, 40, 60, 80, 100, 120 and 140 kg N/ha)
as effluent from a biodigester charged with pig manure. The fresh biomass yield
was linearly related with the level of effluent N (Y = 7.12 + 0.118X, R2= 0.96) reaching 23.6 tonnes/ha
with140 kg N/ha. The yield response in the second harvest (re-growth), when the
same levels of effluent N were applied, was much less reaching a maximum of 16
tonnes/ha of fresh biomass with 140 kg N/ha, and with a more variable response
(Y = 7.03 + 0.0502X, R2= 0.64).
It was concluded that: on the basis of total N content, biodigester effluent had a similar value as urea for fertilization of water spinach; and the yield response to effluent was linear over the range of 0 to 140 kg N/ha. In the first growth period, with 140 kg N/ha of effluent, 54% of the applied N was converted to N in the water spinach.
In Cambodia about 50% of all children aged 0-5
years are either stunted or underweight, which appears to be due to long term
chronic under-nutrition rather than wasting from short-term, severe food
shortages (UNDP 1997). Micronutrient deficiencies in the diet result in
improper physical and mental development in children as well as adults, which
is responsible for lower productivity and inferior quality of life. Leafy
vegetables can contribute significant amounts of vitamins and minerals, and are
especially excellent sources of protein, carotene (vitamin A), iron and
ascorbic acid (vitamin C). The vegetable consumption in Cambodia is reported to
be one of the lowest in the world, being only 35 kg per person per annum (DOA
1994). This is equivalent to only 30% of the recommended daily intake of
vegetables (300g/day according to WHO). Therefore, a “ home garden “ for
growing of vegetables is one way to improve the quality of life of the
Cambodian people by increasing nutritional status and generating income as
well.
Cambodia’s economy is largely based on
agriculture. Approximately 80% of the population live in rural areas and grow
rice as their staple crop. Vegetable production is of secondary importance and
is mainly in lowland areas, especially in the Mekong delta region where the
soil is very fertile. The farm size in
Cambodia is generally small especially concerning the vegetable
garden and the soil is very poor. So the intensive cultivation and improved
productivity per unit area is a key factor for rural economic and social
development.
The vegetable production in Cambodia is mainly
dependent on external inputs in the form of
seeds, pesticides and chemical fertilizers. Most farmers cannot afford
the chemical inputs and this leads to very low yields. Vegetables require many
nutrient elements for good growth and production but N, P and K are the three
elements of most concern. Leafy vegetables are especially heavy users of
nitrogen.
Animal manure is a potential replacement for
chemical fertilizer and is traditionally used by poor farmers in Cambodia.
However, it is not properly managed so that the efficiency of utilization of
the manure is very low. The introduction of low-cost biodigesters in Southeast
Asia (Bui Xuan An et al 1997) has made it possible for small-scale farmers to
convert manure into biogas and a nutrient rich effluent. Le Ha Chau (1998a,b)
showed that cassava and duckweed yielded more biomass of a higher protein
content when effluent rather than manure was used as the fertilizer.
Water spinach is used traditionally in
Cambodia as a vegetable for consumption by people and animals. It has a short growth period and is
resistant to common insect pests. However, there appears to be no information
in the literature on its response to fertilizer especially fertilizer of
organic origin as is produced by the anaerobic digestion of livestock manure.
The following experiments were carried out
to evaluate the potential of water spinach to utilize the effluent from
biodigesters charged with pig manure. The first experiment aimed to compare
biodigester effluent with urea, which is the fertilizer most commonly used by
vegetable farmers in Cambodia. The
second experiment was designed to derive the response curve of biomass yield to
increasing levels of biodigester effluent as the only fertilizer.
The experiment was done in the “ Ecological “ farm of the University of Tropical Agriculture situated in the campus of the Royal University of Agriculture, Chamcar Daung, Dangkor District, about 10 km from Phnom Penh. The experimental area was located on sandy soil derived from alluvial deposits. The pH was 5.45 and the soil had 0.13% of nitrogen (UTA 2001, unpublished data).
The treatments were:
C: control (no fertilizer)
N:
Effluent from a biodigester charged with pig manure at rate of 75 kg N/ha
NH3:
Effluent from a biodigester charged with pig manure applied at 75 kg
ammonia-N/ha
Urea:
Urea applied at 75 kg N/ha
There were 8 replicates of each treatment arranged within two blocks in a completely randomized block design. The plot size was 1.5*1.00 m with a space of 50 cm between plots in each block, which were 10 m apart.
The soil was cultivated by hoe, two times and a
raised bed prepared, which was 15 cm high.
Seeds
of dry-land water spinach were planted on 22 July 2001, in rows
across the bed, at spacing between seeds of 1-2 cm and at 2-3 cm depth. The
distance between rows was 20cm. The distance between plots and rows was 50 cm.
The fertilizers were applied 3 times in the
growing period. Increasing quantities equivalent to 10, 40 and 50% of the total
allowance were applied on days 7, 14 and 21, respectively (Table 1). For each
application fresh quantities of effluent were brought from a biodigester charged
with washings (manure, urine and water) from pigs fed broken rice and water
spinach (Ipomoea aquatica). The effluent was analysed for total nitrogen
(N) and ammonia-N (NH3-N). The quantities of effluent were
calculated on the basis of the total amount of N (75 kg/ha) and the proportion
of the total (10, 40 or 50%) to be applied.
|
Table
1:
Quantities of effluent and urea applied per plot of 1.5 m2
during the experiment |
||||
|
Days |
% of total |
Effluent
(N) |
Effluent
(NH3-N) |
Urea,
g |
|
7 |
10 |
4.89 |
5.02 |
2.45 |
|
14 |
40 |
13.6 |
11.4 |
9.78 |
|
21 |
50 |
16.1 |
26.8 |
12.2 |
|
Total |
100 |
34.6 |
43.2 |
24.5 |
A watering can was used to apply water twice a
day (morning and afternoon) at the rate of 3 to 4 litres/m²). On rainy days no
water was applied.
Plant height was measured and number of leaves
counted weekly before applying the fertilizers. The water spinach was harvested
28 days after planting. All plants in individual plots were weighed. Leaf and
stem were separated and analysed immediately after harvest to determine dry
matter by microwave radiation (Undersander et al 1993) and nitrogen (Foss
Tecator kjeldahl apparatus; AOAC 1990). Samples of soil were taken from each
plot before planting and after harvest for analysis of dry matter, nitrogen,
ash, organic matter and pH.
Before planting and after harvesting the water
spinach, two samples of soil (2 kg) were taken from the 0 – 20 cm layer in each
plot and put into plastic bags. Three seeds of maize were planted in each
plastic bag. The bags were watered every day. One week after planting the
number of maize plants was reduced to one per bag for the growing test. After
30 days the height to the growing point was recorded and the biomass harvested
and weighed fresh.
The data were analysed by ANOVA using the
General Linear Model (GML) software of Minitab (Version Release 12.21). The
variables were fertilizer treatments, blocks and error.
The experiment was carried out in the same location and with the same
plots used for Experiment 1.
The design was a production function with 8 levels of fertilization with biodigester effluent, equivalent to N levels of 0, 20, 40, 60, 80, 100, 120, 140 kg/ha. Two harvests were made at intervals of 28 days and the fertilizer treatments were repeated in each of the two consecutive growth periods There were 4 replicates of each treatment. The plots used for each replicate were those used previously for each of the four fertilizer treatments applied in Experiment 1.
The plots were cultivated by hoe two times before re-making the raised beds. There was an interval of 7 days from the time of the harvest in Experiment 1 and planting the seed in Experiment 2, which was done on 25 August 2001.
The procedures were similar to those described in Experiment 1, except that no analyses were done on the soil.
Two harvests were made at intervals of 28 days.
The original hypothesis was that the water spinach would respond more to
the ammonia nitrogen present in the effluent rather than to the total nitrogen
a proportion of which would be in organic form and thus less available to a
rapidly growing plant such as water spinach.
Unfortunately there appeared to be considerable variation in the proportion
of ammonia in the effluent applied on each occasion, with values ranging from
0.49 to 0.99 (Table 2).
|
Table 2: Composition of the effluent and urea applied on the three
occasions during the growth of the water spinach in the first growth period |
|||||
|
Days |
Effluent, |
Effluent, |
Effluent,
mg NH3-N/litre |
Effluent, |
Urea, |
|
7 |
230 |
224 |
184 |
0.802 |
46 |
|
14 |
330 |
395 |
325 |
0.986 |
46 |
|
21 |
350 |
210 |
173 |
0.494 |
46 |
The digested waste (effluent) is a high quality fertilizer. The
digestion process converts a proportion of the nitrogen in the organic
materials to ionic ammonia (NH4+), a form that becomes more stable when
ploughed into the soil. The ammonia ion is readily “fixed” in the soil so that
it can be absorbed by plants. However,
there is little information on the proportion of the nitrogen that is converted
to the ionized form. It is not known if the very high value recorded in the
effluent applied on day 14 was a true value or the result of analytical error.
Recent analyses of total nitrogen and ammonia nitrogen in the manure fed into
the biodigester and the corresponding effluent indicated proportions of ammonia
nitrogen of 0.11 and 0.06, respectively in fresh manure from cattle and pigs
increasing to 0.62 and 0.67 in the effluent (Pok Samkol and Chan Noeng 2001,
unpublished data). As the application of the effluent in the N and NH3-N treatment was based on the reported analyses
(Table 2), the amounts of effluent applied on day 21 were much greater for the
NH3-N treatment (26.8 litres) than for the N treatment (16.1 litres) with
corresponding total amounts applied during the experiment being 43.2 and 34.6
litres (Table 1).
There were no differences among fertilizer
treatments in the soil pH (P=0.28) or in the organic matter content (P=0.43)
after harvesting of the water spinach (Tables 3 and 4 and Figures 1 and
2). However, on all fertilizer
treatments the soil pH was almost one unit higher after growing the water
spinach (P=0.001). By contrast, the
organic matter content decreased when no fertilizer was applied and increased
on the urea treatment. There were no changes for the two effluent treatments.
|
Table 3: Least square means for pH of the soil
before and at the end of the first growth period for the control, “N” , “NH3”
and urea fertilizer treatments. |
||||||
|
|
Control |
N |
NH3 |
Urea |
Mean |
SEM/Prob |
|
Before |
4.64 |
4.73 |
4.80 |
4.49 |
4.67 |
0.039/0.001 |
|
After |
5.52 |
5.41 |
5.42 |
5.40 |
5.44 |
|
|
Mean |
5.08 |
5.07 |
5.11 |
4.94 |
|
|
|
SEM/Prob |
0.055/0.17 |
|
|
|
||
|
Table 4: Least square means for organic matter of
the soil before and at the end of the experiment for the control, “N” , “NH3”
and urea fertilizer treatments |
||||||
|
|
Control |
N |
NH3 |
Urea |
Mean |
SEM/Prob |
|
Before |
2.76 |
1.97 |
2.15 |
1.92 |
2.20 |
0.184/0.852 |
|
After |
2.23 |
2.04 |
2.19 |
2.54 |
2.25 |
|
|
Mean |
2.49 |
2.01 |
2.17 |
2.23 |
|
|
|
SEM/Prob |
0.26/0.62 |
|
|
|||
|
Figure 1. Effect of different
sources of fertilizer on soil pH before and after growing of water spinach |
|
There was reasonable uniformity among treatment
plots in overall soil fertility before starting the experiment, as measured by
the maize test (P=0.311) but a tendency for it to be less on the urea treatment
(Tables 4 and 5; Figure 3). On all
treatments there was an apparent decrease (P=0.091) in soil fertility after
growing the water spinach, however, as the maize growth is subject to the
prevailing climatic conditions during the test, caution is needed in
interpreting differences between tests done at different times. The use of sand as a reference medium, as
demonstrated by Chamnanwit Promkot (2001), would have given more validity to the
interpretation of differences between tests at different times.
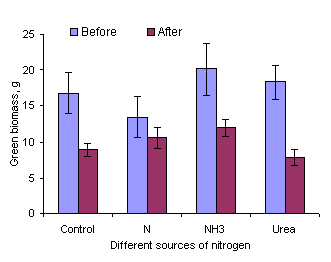
Figure 3.
Effect of different sources of fertilizer on growth rates of maize
(soil biotest) before and after planting water spinach
|
Table 5: Least square means for the biotest (weight
of maize plant, g) of the soil before
and at the end of the experiment |
||||||
|
|
C |
N |
NH3 |
Urea |
Mean |
SEM/Prob |
|
Before |
16.7 |
13.4 |
20.1 |
18.3 |
17.1 |
1.59/0.311 |
|
After |
8.91 |
10.6 |
11.9 |
7.83 |
9.83 |
|
|
Mean |
12.8 |
12.0 |
16.0 |
13.0 |
|
|
|
SEM/Prob |
1.27/0.001 |
|
|
|||
There were no differences between the two
levels of effluent (based on total N and ammonia-N) in the effects on the
height and green biomass yield of the water spinach. Both these treatments
tended to support higher yields than urea alone, which in turn was superior to
the control (Table 6; Figures 4 and 5).
|
Table 6:
Least square means for height and yield of water spinach in plots of
1.5m² according to fertilizer treatment |
|||||
|
|
Control |
N |
NH3 |
Urea |
SEM/Prob. |
|
Height, cm |
19.7c |
34.5a |
34.8a |
30.7b |
0.71/0.001 |
|
Biomass yield, g fresh weight per plot |
|||||
|
Green material |
6.58c |
17.6ab |
18.6a |
15.5b |
1.23/0.001 |
|
Roots |
1.50b |
2.24a |
2.16a |
2.12a |
0.14/0.001 |
|
abc Means within rows without letter in common are
different (P< 0.05) |
|||||
|
Figure 4. Effect of different sources of fertilizer on height of water spinach after 28 days growth |
Figure 5. Effect of different sources of fertilizer on green
biomass yield of water spinach at 28 days |
The plots receiving the ammonia-N treatment received 25% more effluent than
those where the effluent was applied
according to the total N content, yet the yields differed by only 6%. This
implies that the total N content is as good a guide to the fertiliser value of
biodigester effluent as is the content of N in the form of NH4+ and that there was little benefit from the
extra 25% of N on the “NH3” treatment.
There is no obvious explanation for the latter result, other than that the uptake of N was less
when the highest quantities were
applied on day 21 of the growth period. That effluent should be superior to
urea is not surprising as the effluent supplies a variety of other nutrients,
including phosphorus, potassium and other minor elements all of which are
needed for plant growth. In an experiment in southern Minnesota, comparing pig
manure and nitrate-N fertilizer, maize yields were greater for the pig manure
than for the commercial fertilizer at six of the seven sites (Randall 1998). Cushman et al (1999) compared commercial nitrate fertilizer and swine effluent for production of
vegetable crops in Mississippi and showed that all treatments receiving swine effluent always yielded equal to or greater
than treatments that received commercial fertilizers.
These results also showed that differences in the predominating nitrogen form,
that is nitrate nitrogen (NO3) from commercial fertilizer sources or
ammonia-N from the effluent source, did not affect
yield or quality of the vegetables (Cushman et al 1999).
The yield on the best treatment was
equivalent to 18.6 tonnes fresh biomass/ha in one month of growth. On a yearly basis, assuming irrigation is
available, this is equivalent to 223 tonnes fresh biomass/ha, which with a dry matter content of 8% is 18 tonnes of dry
matter. This indicates there is a very high potential for the use of water
spinach as an appropriate crop to exploit the use of biodigester effluent in
integrated farming systems.
There was an interaction (P=0.001) between
growth periods and effects of the level of effluent in the first harvest (Figures 6 and 7). The water spinach had a
very similar height on all effluent levels following the first application of
effluent, which was 20% of the total amount. At the second measurement on day
14, differences due to effluent level became apparent, and these were magnified
considerably by day 21 (Table 7).
|
Figure 6. Effect of effluent level on height of water spinach |
Figure 7. Effect of level of effluent on number of leaves of
water spinach. |
There were no differences among levels of
effluent in the effects on the number of leaves (Table 8), but there were big
differences between periods (P=0.001).
|
Table 7:
Least square means for height (cm) of water spinach in plots of 1.5m²
according to level of effluent N |
|||||||||
|
Growth |
Level of
effluent, kg N/ha |
SEM/Prob |
|||||||
|
0 |
20 |
40 |
60 |
80 |
100 |
120 |
140 |
||
|
14 days |
8.07 |
8.01 |
6.70 |
7.74 |
8.52 |
9.02 |
8.40 |
11.1 |
0.37/0.001 |
|
21 days |
15.3 |
18.15 |
16.4 |
18.9 |
21.3 |
23.5 |
22.8 |
26.4 |
0.66/0.001 |
|
28 days |
23.9 |
31.0 |
30.24 |
37.3 |
39.3 |
45.4 |
42.6 |
48.8 |
1.18/0.001 |
|
Table 8:
Least square means for numbers of leaves of water spinach in plots of
1.5m² according to level of effluent |
|||||||||
|
Periods |
Level of
effluent kg N/ha |
SEM/Prob |
|||||||
|
0 |
20 |
40 |
60 |
80 |
100 |
120 |
140 |
||
|
14 days |
5.90 |
5.95 |
5.50 |
5.65 |
5.97 |
5.87 |
5.95 |
6.17 |
0.14/0.001 |
|
21 days |
8.95 |
9.27 |
8.47 |
8.82 |
9.42 |
9.42 |
9.05 |
9.80 |
0.19/0.001 |
|
28 days |
11.3 |
12.0 |
11.5 |
12.0 |
12.4 |
12.9 |
12.1 |
12.8 |
0.22/0.001 |
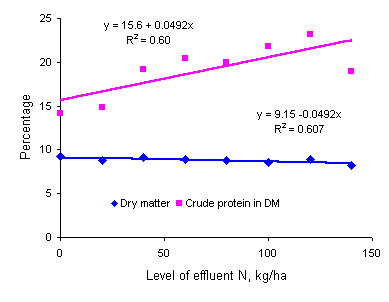
Figure 8. Effect of level of effluent on dry matter
and crude protein content
of whole water spinach (stem and leaves).
There were tendencies for the dry matter content to decrease slightly (Y = 9.16 – 0.0497X±0.0026) and for crude protein to increase (Y = 15.6 + 0.0492X±0.016) as the effluent level was increased (Figure 8).
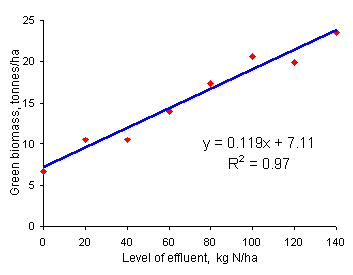
Figure 9. Effect of effluent on green biomass yield
of water spinach (first harvest after planting 28 days)
The response of biomass yield to effluent
level was linear over the range of 0 to 140 kg N/ha (Figure 9; Table 9).
|
Table 9:
Least square means for fresh biomass yield of water spinach according
to level of effluent (first harvest) |
|||||||||
|
|
Level of
effluent kg N/ha |
SEM/Prob |
|||||||
|
0 |
20 |
40 |
60 |
80 |
100 |
120 |
140 |
||
|
Biomass, tonnes/ha |
6.66 |
10.5 |
10.6 |
14.1 |
17.4 |
20.7 |
20.0 |
23.6 |
1.44/0.001 |
The fact that the yield response was linear up to the maximum level applied (140 kg N/ha) implies that there might have been responses to even higher levels of application of effluent N. Although climatic conditions and soils are very different, it is interesting to compare the levels of N used in the present study with the recommendations for leafy vegetables, typically recommended in the UK (MAFF 1994) (eg: 300 kg N/ha for sprouts, 250 kg N/ha for cauliflowers and 200 kg N/ha for lettuce).
Biomass yields were lower for the second
harvest (Figure 10; Table 10) compared with the first harvest (Figure 9; Table
9) and the response was less consistent, with apparently lowest yields for the
40 and 60 kg N/ha levels. The variation may have been caused by the
exceptionally heavy rain which fell during the re-growth phase. The yield of
fresh biomass with 140 kg N/ha was 16 tonnes/ha compared with 24 tonnes/ha in the first harvest.
|
Table 10:
Least square means for fresh biomass yield of water spinach according
to level of effluent (second harvest) |
|||||||||
|
|
Level of
effluent, kg N/ha |
SEM/Prob |
|||||||
|
0 |
20 |
40 |
60 |
80 |
100 |
120 |
140 |
||
|
Fresh biomass, tonnes/ha |
9.25 |
9.16 |
7.41 |
7.00 |
11.0 |
11.0 |
13.2 |
16.3 |
1.92/0.04 |
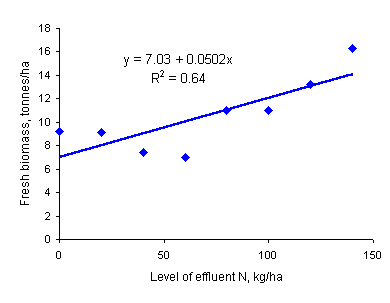
Figure 10. Effect of different levels of effluent Non
biomass yield
of water spinach (second harvest)
The dry matter content of the leaf tended to be higher than in the stem but there was no apparent effect of the level of effluent (Figure 11).

Figure 11. Effect of different levels of effluent N on the dry matter content
of the leaves and stem of water spinach (second harvest)
The protein content of the leaf of water spinach was higher than in the stem but, as in the case of the dry matter content, there was no relationship with the level of effluent N that was applied (Figure 12).

Figure 12. Effect of different levels of effluent N
on the crude protein content
of the stems and leaves of water spinach
The efficiency with which nutrients are
recycled is an important indicator of the sustainability of the farming system.
For the first harvest, the transfer of nitrogen into the foliage of the water
spinach was 54% of the quantity of nitrogen applied in the effluent (Table
11). The comparable figure for cassava
managed as a forage crop and fertilized with effluent from a biodigester
charged with pig manure was 67%.
|
Table
11. Recovery of nitrogen in
the foliage of water spinach and cassava when fertilized with biodigester
effluent |
||||||
|
Crops |
N applied, |
Biomass yield, |
DM, |
N in DM, |
N in biomass, kg/ha |
Recovery of N |
|
Water spinach |
140 |
24000 |
9 |
3.50 |
75.6 |
54.0 |
|
Cassava# |
100 |
8700 |
22 |
3.52 |
67.4 |
67.4 |
|
# Le Ha
Chau 1998a |
||||||
AOAC 1990
Official Methods of Analysis. Association of Official Analytical
Chemists. 15th edition (K Helrick editor) Arlington pp 1230
Bui Xuan An, Preston T R and
Dolberg F 1997 The
introduction of low-cost polyethylene tube
biodigesters on small scale farms in Vietnam. Livestock Research for Rural
Development (9) 2: http://www.cipav.org.co/lrrd/lrrd9/2/an92.htm
Chamnanwit Promkot 2001 Study of the use
of maize and water spinach in a biotest for evaluation of soil fertility.
Mini-projects in MEKARN MSc course (http://www.forum.org.kh/~
mekarn)
Cushman K, Bufogle A, and Horgan T 1999 Proceedings of the 28th National Agricultural Plastics Congress, Tallahassee, Florida, p.168.
Le Ha Chau 1998a Biodigester effluent versus
manure from pigs or cattle as fertilizer for production of cassava foliage
(Manihot esculenta). Livestock Research for Rural Development (10) 3: http://cipav.org.co/lrrd/lrrd10/3/chau1.htm
Le Ha Chau 1998b Biodigester effluent versus
manure from pigs or cattle as fertilizer for duckweed (Lemna spp.) Livestock Research for Rural Development (10) 3: http://www.cipav.org.co/lrrd/lrrd10/3/chau2.htm
MAFF 1994. Fertilizer Recommendations
for agricultural and horticultural crops. Reference Book 209, 6th edition
.London. HMSO.
Randall G 1998 Hog manure boosts corn yield more than
fertilizer in U of M study. University of Minnesota Extension Service. http://www.extension.umn.edu/extensionnews/1998/JO1013.html
Undersander D, Mertens D R and Thiex N 1993 Forage analysis procedures. National Forage Testing
Association. Omaha pp:154
UNDP 1997 Annual Report