|
|
|
|
Photo 1. Soil |
Photo 2. Sand |
Photo 3. Bio-char |
| Contents | MEKARN MSc 2008-10; Miniprojects |
The experiment was conducted at Kampong Cham National school of Agriculture, Cambodia from 04 August to 15 September, 2008. Bio-char was produced in Colombia, from a gasifier using sugar cane bagasse as the fuel. Soil and sand collected in the farm of Kampong Cham National School of Agriculture to measure effect of bio-char added into soil with difference levels by using the bio-test with maize (Zea mays) as indicators, according to a 5*2 factorial arrangement with two replications. Concentrate bio-char added into soils was 0%, 2%, 4%, 6%, 8% which were put into 2 liters capacity plastic bags and 3 seeds of maize was planted in each bag (2 bags per level of bio-char per soil or sand soil). Date to germinate, plant height at every 5 days intervals and final weight of biomass after 30 days were measured.
There were non significant differences between levels of bio-char added in the growth in height and the amount of biomass of the maize after 30 days measurements. There was a positive curvilinear response of biomass weight to height of maize (R2= 0.86), but negative response between biomass and levels of bio-char added.
It is suggested that bio-char added in soils have low pH and concentration of carbon in soil is also low. However, this possibility needs further research about the limit of pH when supplying bio-char by the bio-test method is a simple or what kind of soil pH can supply to reduce cost procedure in integrated farming systems.
Nowadays, fertilizer is very important in agriculture, especially with poor soil. Moreover, the price of the fertilizer is more and more expensive so, using another resource to replace fertilizer is very important for poor rural farmers. Bio-char is the product of biomass pyrolysis that not only sequesters carbon when applied to soil, but also improves soil quality dramatically.
Biochar is a high-carbon, fine-grained residue which can be produced either by smoldering biomass utilizing centuries-old techniques (i.e., covering burning biomass with soil and letting it smolder) or through modern pyrolysis processes. Pyrolysis is the direct thermal decomposition of biomass in the absence of oxygen to obtain an array of solid (biochar), liquid (bio-oil) and gas (syngas) products. The specific yield from the pyrolysis is dependent on process conditions, and can be optimized to produce either energy or biochar (Gaunt et al 2008).
Soil organic matter consists of a variety of components. These include, in varying proportions and many intermediate stages: raw plant residues and microorganisms (1 to 10 percent), "active" organic traction (10 to 40 percent) resistant or stable organic matter (40 to 60 percent) also referred to as humus. Organic matter in soil serves several functions. From a practical agricultural standpoint, it is important for two main reasons: First as a "revolving nutrient bank account"; and second, as an agent to improve soil structure, maintain tilth, and minimize erosion (J. Lickacz et al 2001).
The measurement of the fertility of soils is usually done by chemical analysis for plant nutrients such as nitrogen (N), potassium (K), phosphorus (P) and trace elements, as well as physical measurements of soil structure. Such analyses require access to a laboratory and this is not feasible for most farmers, especially those with limited resources. Planting some indicator plants in the soil and measuring their growth and production is one way to measure fertility of soils in an indirect way (Nguyen Phuc Tien et al 2003).
Maize (Zea mays) is widely cultivated in the tropics and sub-tropics for both human and animal feed. It requires a long, warm period to ripen the grain and cannot withstand frost. There are many types of maize and the grain may be yellow, white or red. The maize bio-test is suitable for evaluation of soil fertility (Promkot 2001).
Besides, bio-char also has positive effects in both reducing emissions and increasing the sequestration of greenhouse gases. The production of bio-char and its application to soil will deliver immediate benefits through improved soil fertility and increased crop production (Lehmann et al 2006).
Higher nutrient availability for plants is the result of both the direct nutrient addition by the bio-char and greater nutrient retention (Lehmann et al 2003).
Bio-char additions not only affect microbial populations and activity in soil, but also plant–microbe interactions through their effects on nutrient availability and modification of habitat. Rhizobia spp. living in symbiosis with many legume species are able to reduce atmospheric N2 to organic nitrogen through a series of enzymatic reactions (Giller 2001).
However, there is little information on the most appropriate level of bio-char to add to the soil. This will be studied in the following experiment.
Different concentrations of bio-char in the soil will have different effects on the growth of plant.
To measure fertilizer value of bio-char which came from Colombia by using maize as indicator plant.
The experiment will be designed as randomized complete block (RCB) 2*5 factorial design with ten treatments and two replications of each. The factors are:
Five treatments are five levels of biochar (0%, 2%, 4%, 6% and 8%) mixed with soil only. Other five treatments are mixtures of 50% soil:50% sand mixed with five levels of bio-char (0%, 2%, 4%, 6% and 8%)
|
Table 1. The treatments |
|||||||||
|
Levels of bio-char in 100% soil |
Levels of bio-char in 50% soil |
||||||||
|
0% |
2% |
4% |
6% |
8% |
0% |
2% |
4% |
6% |
8% |
|
S-0 |
S-2 |
S-4 |
S-6 |
S-8 |
SS-0 |
SS-2 |
SS-4 |
SS-6 |
SS-8 |
|
Table 2. Experiment layout |
||||||||||
|
Block 1 |
S-0 |
SS-2 |
S-6 |
SS-0 |
S-4 |
S-2 |
SS-8 |
SS-6 |
S-8 |
SS-4 |
|
Block 2 |
S-8 |
S-6 |
SS-2 |
S-4 |
S-0 |
SS-6 |
SS-0 |
S-2 |
SS-4 |
SS-8 |
S: Soil
SS: Mixture (50% sand with 50% soil)
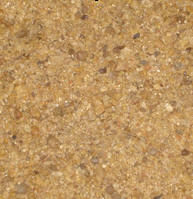
The soil where earthworms live is collected in the farm of Kampong Cham National School of Agriculture (Photo 1). The sand is also collected from the farm of Kampong Cham National School of Agriculture (Photo 2). The biochar was produced in Colombia, from a gasifier using sugar cane bagasse as the fuel (Photo 3).
|
|
|
|
Photo 1. Soil |
Photo 2. Sand |
Photo 3. Bio-char |
Ten treatments will be designed with 5 levels bio-char which will be mixed with soil or mixture (50% soil and 50% sand). They will be put into plastic bags (two liters capacity) which have many holes around so the excess water can go out. Then, 3 seeds of maize will be planted in each bag according to the experimental layout in Table 2. Water will be applied uniformly to all bags every morning and evening except case of raining, observations made of germination and growth of the plants. When the seeds germinate one or two plants will be removed to leave only one seedling in each bag.
|
|
|
Photo 4. Maize with different levels bio-char added in soil |
The soil and sand will be analyzed for the dry matter (DM), organic matter (OM), N and pH; the bio-char will be measured only for DM and organic matter (OM) at the beginning. The height of the plants will be measured every 5 days over a total period of 30 days. After 30 days, the plants and roots will be removed from the bags, washed free of soil, and weighed 30 minutes later, the green parts (leaves and stems) and the roots separately.
The chemical analyses will be done following standard procedures according to the Association of Official Analytical Chemists procedures (AOAC 1990), except for DM which will be determined by micro-wave radiation (Undersander et al 1993).
The data will be analyze by Analysis of variance (ANOVA) using the General Linear Model (GLM) procedure of the Minitab software (version 13.3) to determine growth rate in height of maize. The sources of variables in the model are: Soil type, Levels of bio-char, interaction Soil type*bio-char level and error. The Tukey test in the Minitab software will be used to separate mean values that differ when the F-test is significant at P<0.05.
The soil had percentage of dry matter (DM) is 78.43% lower than sand (97.37%) and bio-char (98%). However, proportion of organic matter (OM) in bio-char was highest (33.44%) and lowest in sand (5.36%). There was 0.28% nitrogen (N) in soil (table 3).
|
Table 3. Chemical composition of soil, sand and bio-char |
|||
|
|
soil |
sand |
bio-char |
|
%DM |
78.43 |
97.37 |
98 |
|
%OM |
31.13 |
5.36 |
33.44 |
|
%N (in DM) |
0.28 |
|
|
|
pH |
6.5 |
6 |
9.5 |
The bio-char had pH high 9.5 (table 3) leads to pH of soil more and more higher than previous added more and more bio-char into the soil. pH of soil with different levels of bio-char were form 6.5 to 9. This result is equivalent to the result of Rodriguez Lylian (2008) in which biochar was supplied (5 % of soil) as shown in following figure 1.
|
|
|
Figure 1: Effect of biochar (5% of soil) on soil pH |
In addition, bio-char contented more than 30% carbon inside so concentrate of carbon in soils form 0 tone per hectare to 32.5 tone per hectare after supplying levels of bio-char form 0 percent to 8 percent into soil (table 4).
|
Table 4. Amount of Carbon and pH in mixture bio-char, soil or sand soil before and after finished experiment |
|||||
|
Level of bio-char in soil, % |
pH before experiment |
pH after finished experiment |
Weight of Carbon, tone/ha |
||
|
soil |
Sand soil |
soil |
Sand soil |
||
|
0 |
6.5 |
6.5 |
5.5 |
6 |
0.0 |
|
2 |
7.5 |
7 |
6 |
6.5 |
8.1 |
|
4 |
8 |
8 |
7 |
7 |
16.2 |
|
6 |
8.5 |
8.5 |
8 |
8 |
24.4 |
|
8 |
8.5 |
9 |
8.5 |
9 |
32.5 |
The germination of maize average from 3.5 to 4 days which were no significant differences (p>0.05) between treatments with different levels of bio-char and different kind of soils.
|
Table 5. Days to germinate of maize |
||
|
Bio-char levels |
Soil |
Soil sand |
|
0 |
3.5 |
3.5 |
|
2 |
3.65 |
3.35 |
|
4 |
3.7 |
3.15 |
|
6 |
3.85 |
3.75 |
|
8 |
3.5 |
4 |
|
SEM/P |
0.26/0.56 |
|
|
SEM = Standard error of mean, P = Probability level |
||
In figure 2, the amount of biomass yield (g DM) of maize decreased from low level to high level of bio-char added to two kind of soils, similar to result in study of Rodriguez Lylian (2008) in Colombia which presented in figure 3.
|
|
|
|
Figure 2. Relationship between total biomass of plant and level of bio-char added to soil |
Figure 3: High levels of biochar on good soil: sand combinations |
Another way, biomass production of maize declined when organic matter (OM) in soil go up. Difference relationships for maize were reported by Boonchan Chantaprasarn et al (2004) and Chamnanwit Promkot (2001).
|
|
|
Figure 4. Relationship between amount of Carbon in soil and total biomass of plant |
The biomass yield had tent to decrease while amount of carbon in soils increase (figure 4). Evidence suggests that significant productivity gains are possible at application rates as low as 0.4 to 8 tones of carbon per ha, but at extremely high applications crop productivity may actually drop due to nitrogen limitation. There is evidence that legumes will thrive under high bio-char applications, perhaps because their nitrogen-fixing ability enables them to compensate for limited nitrogen availability in the soil. This might suggest some potential for New Zealand’s clover-based pasture systems (Peter Winsley 2007). Biochar can reduce nitrogen fertilizer requirements and nitrous oxide emissions (Baum & Weitner, 2006). Actually, Carbon is a cation (ion +) which absorbs nitrogen and nutrient in soil and stores, after that steadily supply for plants in for a long time. However, the soil in this experiment was poor soil (0.28% N) so carbon absorbed nearly all nutrient in soil leaded to the maize did not enough nutrient to grow in the short time.
Therefore, in this experiment amount of carbon in soil was higher than 8 tones per hectare so biomass production of maize low.
|
|
|
Figure 5. Relationship between pH in mixture bio-char, soil and total biomass of maize |
According to Nyle C. Brady et al 1996, soil pH affects phosphorus availability to plants. In alkaline soils, in arid climates, calcium phosphate (CaPO4) is dominant. If soil pH gets too high a chemical reaction takes place that fixes the phosphorus and makes it insoluble and unusable by plants. In addition, Phosphorus (P) plays an important part in how plants and animals form and in how they function and grow. Phosphorus is known to help plants during photosynthesis, P helps plants respire (breathe), P provides energy transfer and storage, and P also helps plants efficiently use water. Seedlings and roots grow more quickly and vegetable and fruit production is increased when plants get enough phosphorus.
In this study, pH in soil increase from 6.5 to 9 leaded to phosphorus insoluble and unusable by maize, for that reason the result maize yield go down. It can be observed from figure 5.
|
|
|
|
Figure 6. Proportion of leaves, stems and roots of maize in soil with difference bio-char levels. |
Figure 7. Total crude protein and organic mater in fresh biomass of maize with different levels bio-char. |
The proportions of roots, stems and leaves in the fresh biomass of maize plants did not differ among the treatment (Figure 6). The content of crude and organic matter also non-significant difference in difference levels of bio-char and difference kind of soils (figure 7).
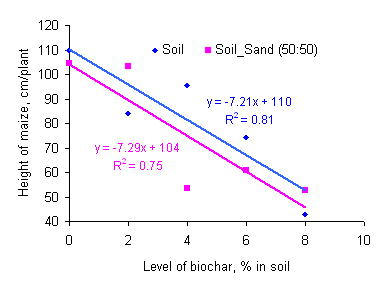
The height after 30 days and growth rate per day of maize was highest (3.67 cm/day) in soil did not add bio-char (0% bio-char) and lowest (1.64 cm/day) in soil added highest level of bio-char (8% bio-char). However, non significant different between the treatments with difference levels of bio-char in soils.
|
Table 6. The height and growth rate of maize |
||||
|
Level of bio-char |
Height at 30 days (cm) |
Grow rate (cm/day) |
||
|
Soil |
Soil sand |
Soil |
Soil sand |
|
|
0 |
110 |
104 |
3.67 |
3.52 |
|
2 |
84.1 |
103 |
2.75 |
3.47 |
|
4 |
95.6 |
53.5 |
3.24 |
1.68 |
|
6 |
74.2 |
60.8 |
2.44 |
1.94 |
|
8 |
42.8 |
52.6 |
1.77 |
1.64 |
|
SEM/P |
19.8/0.60 |
0.59/0.47 |
||
|
SEM = Standard error of mean, P = Probability level |
||||
Figure 8 and 9 point-outs that the height of maize had up down trend either levels of bio-char or pH in soils increase.
According to the research of Taysayavong Lotchana (2008), the response of bio-char with pH in soil is followed this formula y = -0.112x + 1.7278 (R2 = 0.4773) for that reason pH of soil at least 6.5 leads to nearly no effect with bio-char when adding into soils.
|
|
|
|
Figure 8. Relationship between height of maize at harvest and level of bio-char in soil |
Figure 9. Relationship between pH in mixture bio-char, soil and the height of the maize after 30 days |
There is a linear increase (R2=0.86) between two factors: plant height and total biomass yield after 30 days growth, which plant high had more biomass. This information is shown in figure 10.
|
|
|
Figure 10. Relationship between plant height and total biomass yield for maize |
· There are no difference between soil and sand soil as well as the levels of bio-char. Further more, the growth of maize had tent to decrease while concentrate of bio-char added in soil increase.
· Maize growth was closely correlated with carbon and pH of the soils.
· The yield of maize reduce when carbon and pH in soils raise.
· However, this possibility needs further research about what kind of soil appropriate to add bio-char and how concentrate.
· Need supply more nitrogen resource when adding biochar into the poor soil.
The mini-project was carried out at Kampong Cham National school of Agriculture, Cambodia. We wish to thank the SIDA- SAREC for funding this research - a part of the MSc course through the regional MEKARN project. We also would like to express our gratitude to Dr. Do Van Xe, Mr. Chhay Ty of CelAgrid (Cambodia) and Mrs. Latsamy, and Kampong Cham National school of Agriculture staff and students who provided and prepared the materials for conducting the project.
AOAC 1990 Official methods of analysis. Association of Official Analytical Chemists, Arlington, Virginia, 15th edition, 1298 pp.
Baum, E and Weitner, S 2006 Biochar application on soils and cellulosic ethanol production. Clean Air Task Force, Boston, Massachusetts.
Chamnanwit Promkot 2001 Study of the use of maize and water spinach in a biotest for evaluation of soil fertility. MSc. Course 2001-2003, Sida-SAREC http://www.mekarn.org/minipro/cham.htm
Gaunt, John L and Lehmann J 2008 Energy Balance and Emissions Associated with Bio-char Sequestration and Pyrolysis Bioenergy Production, 42 ENVTL. SCI. & TECH. 4152, 4155. http://pubs.acs.org/cgi-bin/abstract.cgi/esthag/2008/42/i11/abs/es071361i.html
Giller, K.E 2001 Nitrogen Fixation in Tropical Cropping Systems, 2nd ed., CAB International, Wallingford.
Lehmann J, Gaunt J and Rondon M 2006 Bio-char sequestration in terrestrial ecosystems – a review, Mitigation and Adaptation Strategies for Global Change (2006), DOI: 10.1007/s11027-005-9006-5. www.css.cornell.edu/faculty/lehmann/publ/MitAdaptStratGlobChange%2011,%20403-427,%20Lehmann,%202006.pdf
Lehmann J, da Silva Jr J P, Steiner C, Nehls T, Zech W and Glaser B 2003 Nutrient availability and leaching in an archaeological Anthrosol and a Ferralsol of the Central Amazon basin: Fertilizer, manure and charcoal amendments, plant soil, 249, 343-357. www.css.cornell.edu/faculty/lehmann/publ/PlantSoil%20249,%20343-357,%202003%20Lehmann.pdf
Lickacz J and Penny D 2001 Soil Organic Matter. http://www1.agric.gov.ab.ca/$department/deptdocs.nsf/all/agdex890
Minitab 2003 Statistical software Version 13.31.
Nguyen Phuc Tien, Ngo Tien Dung, Nguyen Thi Mui, Dinh Van Binh and Preston T R 2003 Improving biomass yield and soil fertility by associations of Flemingia (Flemingia macrophylla) with Mulberry (Morus alba) and cassava (Manihot esculenta) on sloping land in Bavi area. In: Proceedings of Final National Seminar-Workshop on Sustainable Livestock Production on Local Feed Resources (Editors: Reg Preston and Brian Ogle). HUAF-SAREC, Hue City, 25 – 28 March, 2003. Retrieved September 23, 2003, from http://www.mekarn.org/sarec03/tienbavi.htm
Nyle C. Brady and Ray R. Weil, 1996 The Nature and Properties of Soil. Upper Saddle River, NJ 07458; ISBN: 0-02-313371-6, 11th Edition, Prentice Hall, Inc.,. http://www.amazon.com/Nature-Properties-Soils-13th/dp/0130167630/ref=cm_cr_pr_product_top
Peter Winsley 2007 Biochar and bioenergy production for climate change mitigation. Ministry of Agriculture and Forestry, P O BOX 2526, Wellington. New Zealand Science Review Vol 64 (1) 2007. www.biochar-international.org/images/NZSR64_1_Winsley.pdf
Rodriguez Lylian 2008 Effect of biochar on growth of maize in acid soils in Colombia. T R Preston, Personal communication.
Taysayavong Lotchana and Preston T R 2008 Determining the relative fertility of soil using the biotest method with maize as indicator plant. MEKARN MSc 2008-10, Minisoroject, In preparation.
Undersander D, Mertens D R and Lewis B A 1993 Forage analysis procedures. National Forage Testing Association. Omaha pp 154.