|
|
|
|
|
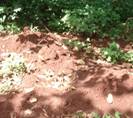
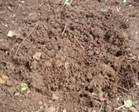
Photo1: Peaty soil |
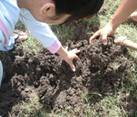
Photo2: Chalky soil |
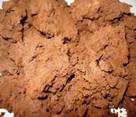
Photo3: Clay soil |
|
|
|
|
|
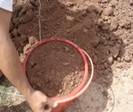
Photo4: Silty soil |
Photo5: Loam with compost |
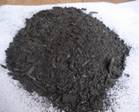
Photo6: Biochar |
| Contents | MEKARN MSc 2008-10; Miniprojects |
The experiment was conducted at Kampong Cham National School of Agriculture, Cambodia. Five types of soil were taken from different places around Kampong Cham district to measure fertility of soils by using the bio-test with maize (Zea mays) as the indicators, according to a 5*2 factorial arrangement with four replications, the factors were: soil, with or without biochar. The soils were peaty soil, chalky soil, clay soil, Silty soil, and loam with compost, (All of soils took around 0-20 cm. depth). The soil samples were put into 1.5 liters capacity plastic bags and 3 seeds of either maize were planted in each bag (4 bags per soil). Date to germination, plant height at every 3 days intervals and final weight of biomass after 26 days were measured.
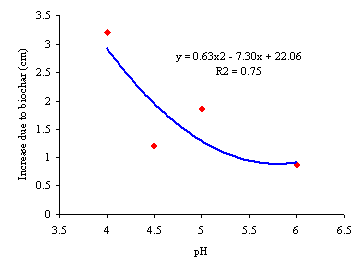
There were significant differences between soils in the growth in height but no effect in the soil that mixing biochar and interaction for soil * Biochar for height measurements of maize. However, soil with mixing biochar; it was increase acid soil to tend to more alkaline, it was suitable for growing maize. Besides that, it was supported the germination of maize was very fast and increased biomass production of maize. In addition, physical composition of soil was positively correlated to plant growth particularly in maize. For maize, There was a close relationship between pH of soil and increase due to biochar (R2 = 0.75).
It is suggested that the biochar increased soils pH, germination and amount of biomass of the maize and field research for a better understanding of biochar material and its ability to maintain soil quality.
The fertility of soils is important in agriculture particularly in making decisions on planting of crops. The measurement of the fertility of soils is usually done by chemical analysis for plant nutrients such as nitrogen (N), potassium (K), phosphorus (P) and trace elements, as well as physical measurements of soil structure. Such analyses require access to a laboratory and this is not feasible for most farmers, especially those with limited resources. Planting some indicator plants in the soil and measuring their growth and production is one way to measure fertility of soils in an indirect way (Chamnanwit Promkot 2001 and Nguyen Phuc Tien 2003). . According to Boonchan Chantaprasarn (2003), maize is a better indicator plant than rice.
Soil organic matter is partially decayed plant and animal matter. It helps the soil hold water and supplies nutrients, which are crucial for crop production; it also protects against erosion and helps support a healthy and diverse set of microscopic plants and animals. Organic matter content, erosion, soil salinity, and soil biological condition are key indicators of soil quality, reflecting the effect of agriculture on soils and the influence of changing crop and soil management practices.
pH is a measurement of how acidic or basic is the soil and is measured using a pH scale between 0 to 14, with acidic media having a pH between 0-7 and basic media having a pH from 7 to 14. For instance, lemon juice and battery acid are acidic and fall in the 0-7 range, whereas seawater and bleach are basic (also called "alkaline") and alkaline soil has a pH of around 8.5 whilst the pH of neutral soil is 7. Most plants grow best in soil with a pH of between 6.5 and 6.8.In addition for maize pH 6.5 sufficient and pH 6.0 sufficient for high pH subsoil (John 2003) The pH of soil or more precisely the pH of the soil solution is very important because soil solution carries in it nutrients such as nitrogen (N), potassium (K), and phosphorus (P) that plants need in specific amounts to grow, thrive, and fight off diseases.
Biochar is biomass (wood plants, plant waste) that has been converted to charcoal and it produced by pyrolysis: heating in the absence of oxygen, which prevent burning of the biomass (which happen in open fires). In addition, Biochar and its byproduct has multiple uses, when added to the soil it can significantly improve soil fertility. Especially if some volatile are left or recycle back in, the volatile fluids and gasses produce usable bio-fuels, that can be produce on the sustainable basic and then the carbon, when recycle into the soil, provides a stable long term removal of carbon (dioxide) from the atmosphere. Removing carbon from the atmosphere is called sequestration (Lukas Van Zwieten 2006 and Rick Davies 2007). Besides that, Biochar can act as a soil conditioner enhancing plant growth by supplying and, more importantly, retaining nutrients and by providing other services such as improving soil physical and biological properties (Glaser et al 2002; Lehmann et al.2003a; Lehmann and Rondon 2005).
Maize (Zea mays) is widely cultivated in the tropics and sub-tropics for both human and animal feed. It requires a long, warm period to ripen the grain and cannot with stand frost. There are many types of maize and the grain may be yellow, white or red. The maize bio-test is suitable for evaluation of soil fertility (Promkot 2001).
In this experiment, maize was chosen as bio-test indicator plant for measuring fertility of soils.
Mixing of biochar with 5 types of soil sample will increase the growth of maize but the increase will depend on the basic fertility of the soils that are chosen.
Compare between 5 types of soil with mixing biochar in each soil by using maize (Zea mays) as biotest indicator plant.
The treatments were source of soils and levels of biochar arranged as a 5*2 factorial in a Completely Randomized Design (CRD) (see Table 1) with 10 treatments and 4 replications. The factors were:
- Soils
- With or without biochar
Five types of soil were compared as show bellow:
|
|
|
|
|
Photo1: Peaty soil |
Photo2: Chalky soil |
Photo3: Clay soil |
|
|
|
|
|
Photo4: Silty soil |
Photo5: Loam with compost |
Photo6: Biochar |
|
Table 1: Experimental layout. |
||||||||||
|
Bag No. |
1 |
2 |
3 |
4 |
5 |
6 |
7 |
8 |
9 |
10 |
|
Treatment |
CK |
PSB |
CSB |
LCB |
PS |
CS |
SSB |
CKB |
LC |
SS |
|
Bag No. |
11 |
12 |
13 |
14 |
15 |
16 |
17 |
18 |
19 |
20 |
|
Treatment |
SSB |
PSB |
CSB |
CS |
CK |
PS |
CKB |
LC |
LCB |
SS |
|
Bag No. |
21 |
22 |
23 |
24 |
25 |
26 |
27 |
28 |
29 |
30 |
|
Treatment |
CSB |
SSB |
PSB |
CKB |
SS |
LC |
CK |
PS |
LCB |
CS |
|
Bag No. |
31 |
32 |
33 |
34 |
35 |
36 |
37 |
38 |
39 |
40 |
|
Treatment |
LC |
PSB |
CKB |
SS |
SSB |
CS |
PS |
LCB |
CSB |
CK |
PS = Peaty soil
· CK= Chalky soil
CS = Clay soil
SS = Silty soil
LC = Loam with compost
PSB = Peaty soil, 5% Biochar
CKB = Chalky soil, 5% Biochar
CSB = Clay soil, 5% Biochar
SSB = Silty soil, 5% Biochar
LCB = Loam with compost, 5% Biochar
|
Table 2 : 5 types of soil |
|
|
Types of soil |
Detail |
|
Peaty soil |
Took from it’s far from Kompong Cham National school of Agriculture Livestock around 30 Km, 0-20 cm. depths. |
|
Chalky soil |
Took from rice field it’s far from Kompong Cham National school of Agriculture Livestock around 25 Km.0-20 cm. depths. |
|
Clay soil |
Took from rice field it’s far from Kompong Cham National school of Agriculture Livestock around 20 Km.0-20 cm. depths. |
|
Silty soil |
Took from rice field it’s far from Kompong Cham National school of Agriculture Livestock around 15 Km.more than 20 cm. depth |
|
Loam with compost |
Loam with compost Took from Kompong Cham National school of Agriculture Livestock, 0-20 cm. depth. |
The one indicator plant was:
M = Maize
Five types of soil (see Table 2) were taken from different places around Kampong Cham province and put into plastic bags (1.5 litters). Three seeds of maize were planted in each bag according to the experimental layout in Table 1. A hole was put in the bottom of each bag so the excess water could drain away. Water was applied uniformly to all bags every morning and evening and observations made of germination and growth of the plants. When the seeds had germinated 1 or 2 plants were removed to leave only one seedling in each bag. In addition the Color of plant, germination and growth of plants were observed every day. After germination the height of the plants were measured every 3 days over a total period of 30 days.After 30 days, the plants and roots were removed from the bags, were washed free of soil, and weighed 30 minutes later, the green parts (leaves and stems) and the roots separately.
Soil simples were analyzed for dry matter (DM), nitrogen (N), Ash, organic matter (OM), and pH at the beginning. The heights of the plants were measured every 3 days over a total period of 26 days. After 26 days, the plants and roots were removed from the bags, washed free of soil, and weighed 30 minutes later, the green parts (leaves and stems) and the roots separately.
The DM contents were determined using the micro-wave relation method of undersander et al (1993). N, OM and Ash were determined following by AOAC (1990) procedures. Except for pH of soil samples were determined by using Soil pH Test Kit (compare with examine color in natural light not fluorescent).
The linear regression of height on days was calculated to determine growth rate in height. The ANOVA GLM option of the Minitab software (version 13.1) was used to analyze the data. The sources of variation in the model were: soils, biochar, and interaction soil*biochar and error. The Tukey test in the Minitab software was used to separate mean values that differed when the F-test was significant at P<0.05.
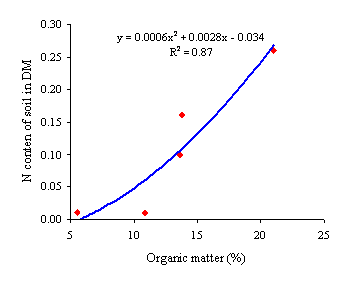
The DM content was highest in the peaty soil and lowest in the clay soil. The soils with high organic matter content were also high in nitrogen (Figure 1). Organic matter was highest in the Loam with compost (LC) and lowest in Silty soil (SS). Most of the soils were acidic (pH <7). Also Nitrogen content was highest in Loam with compost (0.261 %) and lowest in Silty soil (0.012 %). For biochar there was no nitrogen and it was slightly alkaline (pH 9.5), that why when mixture with biochar into soils, it was increase the pH of soil (Table 3).
|
Table 3: Chemical composition of soil |
||||||
|
Types of soil |
DM (%)
|
N (%)
|
Ash (%)
|
OM (%)
|
pH
|
|
|
No biochar |
Biochar |
|||||
|
Peaty soil |
97.412 |
0.103 |
86.41 |
13.59 |
4 |
6 |
|
Chalky soil |
90.651 |
0.011 |
89.15 |
10.85 |
6 |
7.5 |
|
Clay soil |
84.273 |
0.162 |
86.24 |
13.76 |
4.5 |
6.5 |
|
Silty soil |
86.141 |
0.012 |
94.33 |
5.57 |
6 |
7.5 |
|
Loam with compost |
88.214 |
0.261 |
79.03 |
20.97 |
5 |
6.5 |
|
Biochar |
63.743 |
- |
64.16 |
35.84 |
- |
9.5 |
|
DM: dry matter, N: nitrogen, OM: organic matter |
|
|
||||
|
|
|
Figure 1: Relationship between nitrogen and organic matter of soils |
|
Table 4: Germination of maize (%) |
||||||
|
Type of soils |
4 days |
5 days |
6 days |
|||
|
No biochar |
Biochar |
No biochar |
Biochar |
No biochar |
Biochar |
|
|
Peaty soil |
25 |
25 |
33 |
75 |
75 |
92 |
|
Chalky soil |
8 |
8 |
42 |
58 |
83 |
92 |
|
Clay soil |
8 |
17 |
25 |
75 |
83 |
83 |
|
Silty soil |
25 |
25 |
42 |
75 |
75 |
83 |
|
Loam with compost |
16 |
25 |
67 |
83 |
83 |
92 |
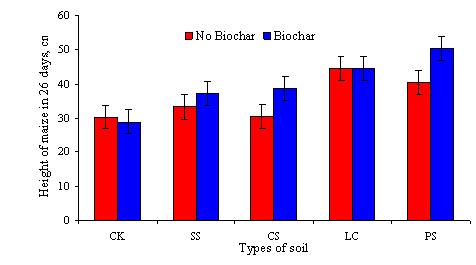
There were significant differences in maize height between soils. However, there were no effect on soil with mixing biochar and interaction between soil and biochar(Table 5).
|
Table 5: Analysis of variance for plant height at 26 days |
||||||
|
Source |
DF |
Seq SS |
Adjusted SS |
Adjusted MS |
F |
P |
|
Soil |
4 |
1521 |
1499 |
375 |
7.6 |
0.001 |
|
Biochar |
1 |
176 |
167 |
167 |
3.39 |
0.075 |
|
Soil*Biochar |
4 |
203 |
203 |
51 |
1.03 |
0.409 |
|
Error |
30 |
1479 |
1479 |
49 |
|
|
|
Total |
39 |
3378 |
|
|
|
|
|
|
|
Figure 2: Effect of soil mixing with or without biochar on height of maize grown in different soils |
|
|
|
Figure 3: Effect of soil pH mixing with biochar on height of maize, |
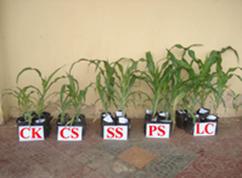
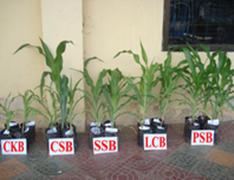
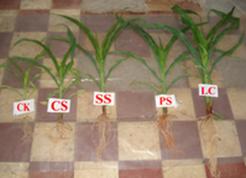
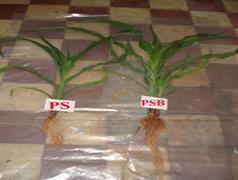
There were different in the responses of maize as the indicator plants (Photo 7 and 8; Figures 4).
|
|
|
|
Photo 7: The height of maize after 26 days. |
|
|
|
|
|
Photo 8: Biomass production of maize after planting 26 days. |
|
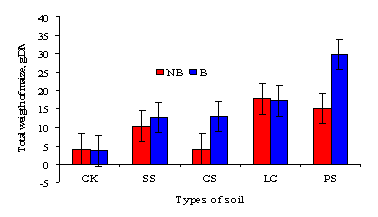
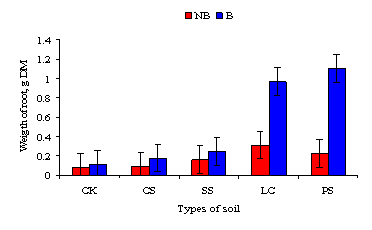
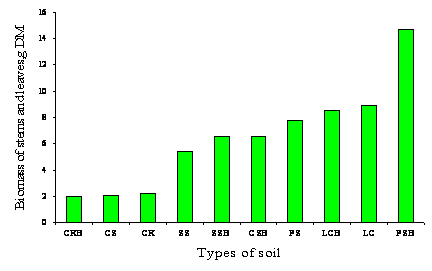
The highest biomass yield with maize was in the soil with mixing biochar. In addition, highest yield of maize was in the peaty soil with mixing 5% biochar (PSB). (figure 4). However, for loam with compost without biochar also higher than Loam with biochar. On the other hand, the lowest yield of maize was in chalky soil with or without biochar (CK and CKB). Besides, there were a lot of amount of root of the maize on soil with mixing biochar (More amount of root was easy to take off nutrient from the soil) (Table 6 and figure 5). Therefore we could say adding biochar to soil would not only dramatically improve soil and increase crop production. But it was in crease biomass of maize.
|
|
|
Figure 4: Effect of soil mixing with or without biochar on Total weight of maize g in different soils |
|
|
|
Figure 5: Effect of soil mixing with or without biochar on Total weight of maize g in different soils |
|
Table 6 : Biomass of maize DM (g) |
||||||||
|
Type of soil |
Leave |
Stem |
Root |
Total |
||||
|
Biochar |
No Biochar |
Biochar |
No Biochar |
Biochar |
No Biochar |
Biochar |
No Biochar |
|
|
Chalky soil |
1.56a |
1.77a |
0.32a |
0.36a |
0.11a |
0.08a |
1.99 |
2.21 |
|
Clay soil |
4.03b |
1.36a |
2.32a |
0.65ba |
0.18a |
0.09a |
6.53 |
2.11 |
|
Silty soil |
4.14b |
3.77b |
2.09a |
1.51a |
0.25a |
0.16a |
6.48 |
5.44 |
|
Loam with compost |
4.78b |
5.27b |
2.75a |
3.29b |
0.97a |
0.32a |
8.49 |
8.87 |
|
Peaty soil |
8.06c |
5.14b |
5.54b |
2.45a |
1.10b |
0.23a |
14.70 |
7.81 |
|
SEM/P between soil |
0.818/0.002 |
0.619/0.003 |
0.100/0.001 |
1.437/0.001 |
||||
|
SEM/P between Biochar |
0.517/0.160 |
0.391/0.097 |
0.063/0.001 |
0.908/0.077 |
||||
|
SEM/P between soil*biochar |
1.16/0.431 |
0.88/0.268 |
0.14/0.014 |
2.03/0.032 |
||||
|
SEM = Standard error of mean, P = Probability level. |
||||||||
|
abc: Value within the same column without superscript in common differ at P<0.05 |
||||||||
|
|
|
Chalky soil (CK), Clay soil (CS), Loam with compost (LC), Peaty soil (PS), Silty soil (SS), Chalky soil with biochar (CKB), Clay soil with biochar (CSB), Loam with compost with biochar (LCB), Peaty soil with biochar (PSB), Silty soil with biochar (SSB) |
|
Figure 6: Green biomass yield of maize in different soils and with or without biochar. |
For low soil pH not only stunts maize growth and development, but can actually kill maize plants in extreme situations. Besides stunted plants, symptoms of low soil pH commonly include a beaded reddish or necrotic striping of the lowermost leaves (sometimes also associated with magnesium deficiency) and brown stubby (thickened) roots (Bob Nielsen 2005). Low pH levels affect nutrients by converting them into forms that are not readily available to the crop. In addition, low pH levels can increase the solubility of plant toxic metals such as aluminum resulting in stunted growth and a general lack of plant Therefore, to obtain optimum plant growth it is critical that soils be limed to increase pH levels. However, when mixing with biochar into Peaty soil which had a low pH content in a neutral material to acidic soil will tend to make it more alkaline, since the total volume of soil has been increased with no increase of acidic chemicals, biochar were neutral, or slightly alkaline, it would decrease the alkalinity of soil that was highly alkaline to begin with by diluting that alkalinity. The same biochar added to highly acidic soil would indeed, make it more alkaline. Both those scenarios assuming biochar that is neutral or slightly alkaline (Andrew J ajmorris 2008). In addition, which was to be expected as improves soil structure and water retention, enhances nutrient availability, and lowers acidity (Winsley Peter 2008). Similar relationships for increases in pH particularly interesting are the improvements in soil physical properties were reported by Tom Miles (2008). And Scientists researching these soils now recognize that biochar makes soil higher in nutrients, better at holding moisture, and lower in pH, or soil acidity (Robert 2008). So, we could say the biochar increased soil pH, water holding capacity, potassium availability, moisture retention and increase soil health.
|
|
| Figure 7: Relationship between pH of soils and height of maize. |
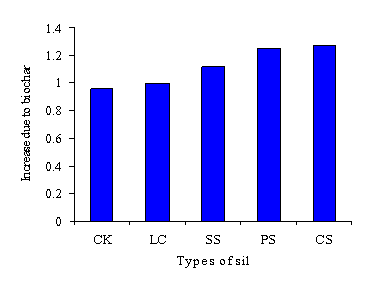
There was a close relationship between pH of soil and increase due to biochar (R2 = 0.75), soil which had a lowest pH was highest because of adding biochar into soils was increases the pH of soil in order to suitable for growing maize.
|
|
|
|
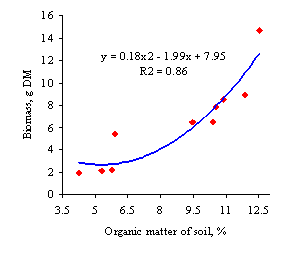
Figure 8: Relationship between organic matter of soils and biomass yield of maize. |
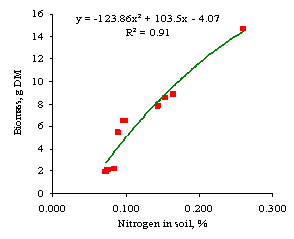
Figure 9:
Relationship between N
content of soil |
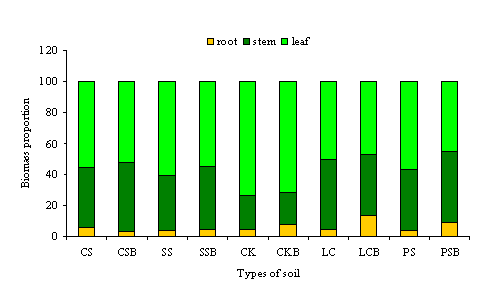
The proportion of green parts (leaves and stems) of the maize growing in low pH of the soil was higher than that of the roots (Figure 10). However, there were a lot of amount of root more than the soil without biochar.
|
|
|
Chalky soil (CK), Clay soil (CS), Loam with compost (LC), Peaty soil (PS), Silty soil (SS), Chalky soil with biochar (CKB), Clay soil with biochar (CSB), Loam with compost with biochar (LCB), Peaty soil with biochar (PSB), Silty soil with biochar (SSB) |
|
Figure 10: Proportion of roots, stems and leaves of plants grown in different types of soil. |
The amount of biomass of maize was higher in soil with mixing biochar, similar with B.Liang and J. Lehmann 2006 reported Biochar may significantly affect nutrient retention and play a key role in a wide range of biogeochemical processes in soils, especially for nutrient cycling. With high contents of biomass .
The height and grow rate of maize
The height and grow rate of maize was highest in peaty soil with mixing 5% biochar (PSB). However, the height and grow rate of maize lowest in the same soil with or without biochar (Chalky soil and Chalky soil with 5% biochar) (Table 7).
|
Table 7: The height and grow rate of maize (cm) |
||||
|
Types of soil |
Height at 26 days |
Grow rate |
||
|
Biochar |
No biochar |
Biochar |
No biochar |
|
|
Chalky soil |
28.981a |
30.406a |
1.115a |
1.169a |
|
Silty soil |
37.328a |
33.346a |
1.436a |
1.283a |
|
Clay soil |
38.653a |
30.448a |
1.487a |
1.171a |
|
Loam with compost |
44.556a |
44.691a |
1.714a |
1.719a |
|
Peaty soil |
50.403a |
40.456a |
1.939a |
1.556a |
|
SEM/P between soil |
2.482/0.001 |
0.095/0.001 |
||
|
SEM/P between Biochar |
1.569/0.075 |
1.538/0.075 |
||
|
SEM/P between soil*biochar |
3.510/0.409 |
0.135/0.409 |
||
|
SEM = Standard error of mean, P = Probability level. |
||||
|
a,b,c:Value within the same column without superscript in common differ at P<0.05 |
||||
|
|
|
|
Figure 11: Relationship between plant height and the green parts for maize. |
Figure 12: Relationship between plant height and total biomass yield for maize |
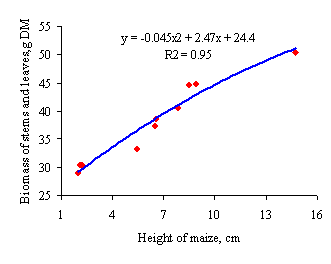
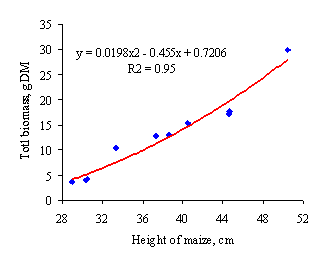
There was a close relationship between maize height, and stems, leaves and total biomass (green parts and roots) yield (Figures 11 and 12).
· Biochar was increase acid soil to tend to make it more alkaline. Besides that, it was facility for maize germinations faster. And also when added biochar into the soil there were a lot of amount of root (More root could take off nutrient easily from soil and transfer to another part of its plant).
· There were no differences among the soils in maize height when 5% biochar was added to the soils. However, the soil that mixing with 5% biochar, it was higher biomass than soil without biochar.
The mini-project was carried out at Kampong Cham National School of Agriculture Cambodia. I would like to thank the SIDA- SAREC for funding this mini-project a part of the MSc program course through the regional MEKARN project. I would like to express gratitude to Dr Thomas R Preston and Dr Do van Xe for patient guidance and encouragement and making it possible for us to complete the mini-project. I also would like to express my sincere thanks to staff of CelAgrid, Mr. Chhay Ty and staff of NAFRI, Ms Latsamy and Kampong Cham National School of Agriculture staff who provided valuable assistance in helping to analyze the data in the laboratory and preparing the materials for conducting the mini-project. Many thanks to my classmates in the MSc course for their contributions, suggestions and friendships.
.
AOAC 1990 Official methods of analysis. Association of Official Analytical Chemists, Arlington, Virginia, 15th edition, 1298 pp.
Andrew J Morris 2008 Biochar and fertilizer http://www.biocharfertilization.com/
Boonchan Chantaprasarn 2003 Measuring fertility of soils by the bio-test method. MEKARN Miniprojects 2003-2005 http://www.mekarn.org/msc2003-05/miniprojects/webpage/cont_mp.htm
B Liang J Lehmann 2006 Black Carbon Increases Cation Exchange Capacity in Soils http://www.css.cornell.edu/faculty/lehmann/publ/SoilSciSocAmJ 70, 1719-1730, 2006 Liang.pdf
Bob Nielsen 2005 Symptoms Associated with Low Soil pH in Corn http://www.ppdl.purdue.edu/PPDL/weeklypics/7-11-05.html
Chamnanwit Promkot 2001 Study of the use of maize and water spinach in a biotest for evaluation of soil fertility. MSc. Course 2001-2003, Sida-SAREC http://www.mekarn.org/MSc 2001-03/minipro/cham.htm
Davies R 2007 Biochar/Agri-char /Terra Preta: Its potential use for carbon sequestration, improve soil fertility and sustainable (carbon-negative) energy production and poverty reduction. http://www.shimbir.demon.co.uk/biocharrefs.htm
Food and Agricultural Organization. Zea mays. http://www.fao.org/ag/aga/agai/far/afris/data
Glaser B Lehmann J and Zech W 2002 ‘Ameliorating physical and chemical properties of highly weathered soils in the tropics with charcoal –Are view’ Biology and Fertility of Soils 35, 219–230.
Greg Roth 2003 Soil fertility extension specialist http://cornandsoybeans.psu.edu/articles/DCP1.html
Grow Veg 2008 The smart way to plan your garden http://www.growveg.com/growguides/soil-types.aspx
Lehmann J and Glaser B 2003 ‘Nutrient availability and leaching in an archaeological Anthrosol and a Ferralsol of the Central Amazon basin: fertilizer, manure and charcoal amendments’, Plant and Soil 249, 343–357.
Lehmann J and Rondon M 2005 ‘Bio-char soil management on highly-weathered soils in the humid tropics’, in N. Uphoff (ed.), Biological Approaches to Sustainable Soil Systems, Boca Raton, CRC Press, in press.
Lehmann J 2007 A handful of carbon. Nature 447 143-144 http://www.css.cornell.edu/faculty/lehmann/publ/Nature%20447,%20143-144,%202007%20Lehmann.pdf
Miles Tom 2007 Agronomic values of green waste biochar as a soil amendment http://terrapreta.bioenergylists.org/chandec2007
Nguyen Phuc Tien, Ngo Tien Dung Nguyen, Theo Mui Dinh Van Binh and Preston T R 2003 Mulberry (Morus alba) and cassava (Manihot esculenta) on sloping land in Bavi area. In: Proceedings of Final Improving biomass yield and soil fertility by associations of Flemingia (Flemingia macrophylla) with National Seminar-Workshop on http://www.mekarn.org/sarec03/tienbavi.htm
Roberts Jeanne 2008 Biochar: A Good Way to Store CO2 http://thepanelist.com/Opinions/Opinions/_20080518999/
Van Zwietenoe Lukas 2006 Magic biochar Recycle fertilizes and sequesters http://www.dpi.nsw.gov.au/archive/agriculture-today-stories/september-2006/magic-biochar
Winsley Peter 2008 Biochar and bioenergy production for climate change mitigation http://alansblog.vox.com/profile/