|
|
|
|
|
Photo1: Peaty soil |
Photo2: Chalky soil |
Photo3: Clay soil |
|
|
|
|
|
Photo4: Silty soil |
Photo5: Loam with compost |
Photo6: Biochar |
| Contents | MEKARN MSc 2008-10; Miniprojects |
Biochar derived from gasification of rice husks (containing 64% ash and 36% carbon; pH of 9.5) was added at 5% (=36 tonnes carbon/ha) to a range of soils (pH from 4.0 to 6.0) taken from different sites in Kampong Cham province. The soils were peaty soil, chalky soil, clay soil, silty soil, and loam with compost. The soil samples were taken at a depth of 0-20cm, put into 1.5 liter capacity plastic bags and 3 seeds of maize planted in each bag (4 bags per soil). After germination one or two maize plants were removed to leave only one plant. The design was a 5*2 factorial arrangement with four replications, the factors being type of soil, with or without biochar. After 30 days the maize plants were harvested for measurements of plant height and weights of green biomass and roots.
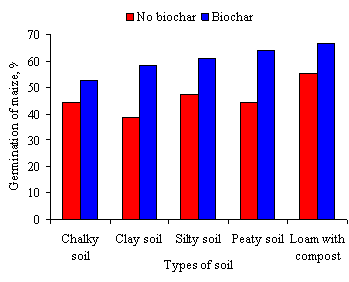
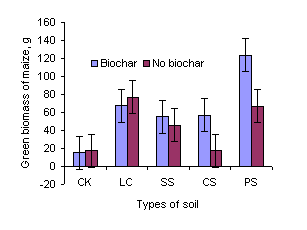
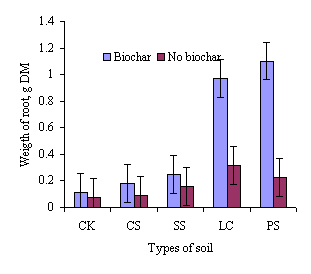
Germination rate was increased by the biochar in all the soils. The biochar increased the height and green biomass yield in the peaty (PS) and clay (CS) soils but had no effect in the chalky (CK) and loam with compost (LC) soils. Responses to the biochar were negatively related to the initial pH of the soil, with no benefits in the soils with pH above 5.0. Root weights were increased by biochar on all the soils.
It is concluded that the response of maize to biochar is pH dependent, with benefits only apparent in soils with initial pH less than 5.0.
The fertility of soils is important in agriculture particularly in making decisions on planting of crops. Soil organic matter is especially important because it is a substrate for soil micro-organisms. It helps the soil to hold water and supplies nutrients, which are crucial for crop production; it also protects against erosion and helps support a healthy and diverse set of microscopic plants and animals. Organic matter content, erosion, soil salinity, and soil biological condition are key indicators of soil quality, reflecting the effect of agriculture on soils and the influence of changing crop and soil management practices.
pH is a measurement of how acidic or basic is the soil and is measured using a pH scale between 0 to 14, with acidic media having a pH between 0-7 and basic media having a pH from 7 to 14. For instance, lemon juice and battery acid are acidic and fall in the 0-7 range, whereas seawater and bleach are basic (also called "alkaline") and alkaline soil has a pH of around 8.5 whilst the pH of neutral soil is 7. Most plants grow best in soil with a pH of between 6.5 and 6.8. For maize a pH of 6.5 is considered to the most appropriate The pH of soil or more precisely the pH of the soil solution is very important because soil solution carries in it nutrients such as nitrogen (N), potassium (K), and phosphorus (P) that plants need in specific amounts to grow, thrive, and fight off diseases.
Biochar is biomass (from woody plants, and fibrous waste) that has been converted to charcoal, a process known as pyrolysis: Pyrolysis means heating in the absence of oxygen, which prevent burning of the the organic biomass (which happens in open fires). It has been shown that biochar has multiple uses. When added to the soil it can significantly improve soil fertility and also act as a sink for carbon (Lehmann 2007). In this way, the carbon is removed from the atmosphere in a process called sequestration (Zwieten 2006; Davies 2007). Besides that, biochar can act as a soil conditioner enhancing plant growth by supplying and, more importantly, retaining nutrients and by providing other services such as improving soil physical and biological properties (Glaser et al 2002; Lehmann and Glaser 2003; Lehmann and Rondon 2005).
The measurement of the fertility of soils is usually done by chemical analysis for plant nutrients such as nitrogen (N), potassium (K), phosphorus (P) and trace elements, as well as physical measurements of soil structure. Such analyses require access to a laboratory and this is not feasible for most farmers, especially those with limited resources. Planting some indicator plants in the soil and measuring their growth and production is one way to measure fertility of soils in an indirect way (Chamnanwit Promkot 2001 and Nguyen Phuc Tien 2003). According to Boonchan Chantaprasarn (2003), maize is a better indicator plant than rice.
It is hypothesized that adding biochar to soil will improve overall soil fertility and that this can be measured in a " bio-test" using the growth rate of maize as the indicator of soil fertility.
The treatments were five source of soils and two levels of biochar arranged as a 5*2 factorial in a Completely Randomized Design (CRD) (see Table 1) with 10 treatments and 4 replications. The factors were:
PS = Peaty soil
CK= Chalky soil
CS = Clay soil
SS = Silty soil
LC = Loam with compost
No biochar
B= Biochar (Photo 6) added at 5% of the soil
|
|
|
|
|
Photo1: Peaty soil |
Photo2: Chalky soil |
Photo3: Clay soil |
|
|
|
|
|
Photo4: Silty soil |
Photo5: Loam with compost |
Photo6: Biochar |
|
Table 1: Experimental layout. |
||||||||||
|
Bag No. |
1 |
2 |
3 |
4 |
5 |
6 |
7 |
8 |
9 |
10 |
|
Treatment |
CK |
PSB |
CSB |
LCB |
PS |
CS |
SSB |
CKB |
LC |
SS |
|
Bag No. |
11 |
12 |
13 |
14 |
15 |
16 |
17 |
18 |
19 |
20 |
|
Treatment |
SSB |
PSB |
CSB |
CS |
CK |
PS |
CKB |
LC |
LCB |
SS |
|
Bag No. |
21 |
22 |
23 |
24 |
25 |
26 |
27 |
28 |
29 |
30 |
|
Treatment |
CSB |
SSB |
PSB |
CKB |
SS |
LC |
CK |
PS |
LCB |
CS |
|
Bag No. |
31 |
32 |
33 |
34 |
35 |
36 |
37 |
38 |
39 |
40 |
|
Treatment |
LC |
PSB |
CKB |
SS |
SSB |
CS |
PS |
LCB |
CSB |
CK |
Five types of soil (see Table 2) were taken from different places around Kampong Cham province and put into plastic bags (1.5 litters).
|
Table 2 : Description of the soils (the top 20cm) |
|
|
Types of soil |
Detail |
|
Peaty soil |
Taken far from Kompong Cham National School of Agriculture around 30 km |
|
Chalky soil |
Taken from a rice field far from Kompong Cham National school of Agriculture around 25 km |
|
Clay soil |
Taken from a rice field far from Kompong Cham National school of Agriculture around 20 km |
|
Silty soil |
Taken from a rice field it’s far from Kompong Cham National school of Agriculture around 15 km |
|
Loam with compost |
Loam with compost taken from Kompong Cham National School of Agriculture. |
The biochar had been produced in a gasifier using rice husks as the fuel. It contained 64% ash and 36% organic matter (presumably carbon) and in the gasifier had been subjected to a temperature of around 600ºC. It was mixed with the different soils at the rate of 5% (air-dry basis).
Three seeds of maize were planted in each bag according to the experimental layout in Table 1. A hole was put in the bottom of each bag so the excess water could drain away. Water was applied uniformly to all bags every morning and evening and observations made of germination and growth of the plants. When the seeds had germinated 1 or 2 plants were removed to leave only one seedling in each bag. In addition the color of the plant, germination rate and growth of plants were observed every day. After germination the height of the plants was measured every 5 days over a total period of 30 days. After 30 days, the plants and roots were removed from the bags, were washed free of soil, and weighed 30 minutes later, the green parts (leaves and stems) and the roots separately.
Soil simples were analyzed for dry matter (DM), nitrogen (N), ash and pH at the beginning.
The DM content was determined using the micro-wave relation method of Undersander et al (1993). Content of N and ash were determined following AOAC (1990) procedures. pH of soil samples was determined colorimetrically using a "Soil pH Test Kit".
The linear regression of height on days was calculated to determine growth rate in height. The ANOVA GLM option of the Minitab software (version 13.1) was used to analyze the data. The sources of variation in the model were: soils, biochar, interaction soil*biochar and error. The Tukey test in the Minitab software was used to separate mean values that differed when the F-test was significant at P<0.05.
The DM content was highest in the peaty soil and lowest in the clay soil (Table 3). The soils with high organic matter content were also high in nitrogen (Figure 1). Organic matter was highest in the Loam with compost (LC) and lowest in Silty soil (SS). Most of the soils were acidic (pH <7). Nitrogen content was highest in the Loam with compost and lowest in the Silty soil. The biochar was highly alkaline (pH 9.5), which is why the mixing of the biochar in the soils led to increases in the pH (Table 3).
|
Table 3: Chemical composition of soil |
||||||
|
Types of soil |
DM (%) |
N (%) |
Ash (%) |
OM (%) |
pH |
|
|
No biochar |
Biochar |
|||||
|
Peaty soil |
97.4 |
0.103 |
86.4 |
13.6 |
4.0 |
6.0 |
|
Chalky soil |
90.6 |
0.011 |
89.2 |
10.8 |
6.0 |
7.5 |
|
Clay soil |
84.3 |
0.162 |
86.2 |
13.8 |
4.5 |
6.5 |
|
Silty soil |
86.1 |
0.012 |
94.3 |
5.57 |
6.0 |
7.5 |
|
Loam with compost |
88.2 |
0.261 |
79.0 |
21.0 |
5.0 |
6.5 |
|
Biochar |
63.7 |
- |
64.2 |
35.8 |
- |
9.5 |
|
DM: dry matter, N: nitrogen, OM: organic matter |
|
|
||||
|
|
|
Figure 1: Relationship between nitrogen and organic matter of soils |
The maize germinated faster in the soil containing biochar (Table 4). Especially on day 6 the percentages of maize germinated were higher in the soil with biochar (Figure 2).
|
Table 4: Germination of maize (%) |
||||||
|
Type of soils |
4 days |
5 days |
6 days |
|||
|
No biochar |
Biochar |
No biochar |
Biochar |
No biochar |
Biochar |
|
|
Peaty soil |
25 |
25 |
33 |
75 |
75 |
92 |
|
Chalky soil |
8 |
8 |
42 |
58 |
83 |
92 |
|
Clay soil |
8 |
17 |
25 |
75 |
83 |
83 |
|
Silty soil |
25 |
25 |
42 |
75 |
75 |
83 |
|
Loam with compost |
16 |
25 |
67 |
83 |
83 |
92 |

|
| Figure 2. Effect of the biochar on the
germination of maize in the different soils |
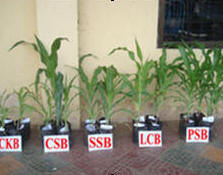
The response to the biochar varied according to the characteristics of the soil (Table 5; Figures 3 and 4; Photos 7 and 8). The biochar increased the maize height in the peaty (PS) and clay (CS) soils but had no effect in the chalky (CK) and loam with compost (LC) soils.
|
Table 5: The height and grow rate of maize |
||||
|
Types of soil |
Height at 26 days, cm |
Growth rate, cm/day |
||
|
Biochar |
No biochar |
Biochar |
No biochar |
|
|
Chalky soil |
28.981a |
30.406a |
1.115a |
1.169a |
|
Silty soil |
37.328a |
33.346a |
1.436a |
1.283a |
|
Clay soil |
38.653a |
30.448a |
1.487a |
1.171a |
|
Loam with compost |
44.556a |
44.691a |
1.714a |
1.719a |
|
Peaty soil |
50.403a |
40.456a |
1.939a |
1.556a |
|
SEM/P between soil |
2.482/0.001 |
0.095/0.001 |
||
|
SEM/P between Biochar |
1.569/0.075 |
1.538/0.075 |
||
|
SEM/P between soil*biochar |
3.510/0.409 |
0.135/0.409 |
||
|
SEM = Standard error of mean, P = Probability level. |
||||
|
a,b,c:Value within the same column without superscript in common differ at P<0.05 |
||||
|
|
|
Figure 3: Effect of biochar on height of the maize grown in the different soils |
|
|
 |
|
Photo 7: The maize plants after 26 days (no biochar) |
Photo 8: The maize plants after 26 days (with biochar) |
As expected , the biomass yield of the maize followed the tendencies in the height of the plant (Table 6; Figure 4). There were major effects of root growth in the Loam plus compost and Peaty soils (Figure 5).
 |
 |
|
Figure 4: Effect of biochar on
weight of green biomass of maize in different soils |
Figure 5: Effect of biochar on root DM of maize in different soils |
|
Table 6 : Biomass of maize DM (g) |
||||||||
|
Type of soil |
Leaves |
Stem |
Root |
Total |
||||
|
Biochar |
No Biochar |
Biochar |
No Biochar |
Biochar |
No Biochar |
Biochar |
No Biochar |
|
|
Chalky soil |
1.56a |
1.77a |
0.32a |
0.36a |
0.11a |
0.08a |
1.99 |
2.21 |
|
Clay soil |
4.03b |
1.36a |
2.32a |
0.65ba |
0.18a |
0.09a |
6.53 |
2.11 |
|
Silty soil |
4.14b |
3.77b |
2.09a |
1.51a |
0.25a |
0.16a |
6.48 |
5.44 |
|
Loam with compost |
4.78b |
5.27b |
2.75a |
3.29a |
0.97a |
0.32a |
8.49 |
8.87 |
|
Peaty soil |
8.06c |
5.14b |
5.54b |
2.45a |
1.10b |
0.23a |
14.70 |
7.81 |
|
SEM/P between soil |
0.818/0.002 |
0.619/0.003 |
0.100/0.001 |
1.437/0.001 |
||||
|
SEM/P between Biochar |
0.517/0.160 |
0.391/0.097 |
0.063/0.001 |
0.908/0.077 |
||||
|
SEM/P between soil*biochar |
1.16/0.431 |
0.88/0.268 |
0.14/0.014 |
2.03/0.032 |
||||
|
SEM = Standard error of mean, P = Probability level. |
||||||||
|
abc: Value within the same column without superscript in common differ at P<0.05 |
||||||||
There was a close relationship (R2 = 0.75) between the initial pH of the soils and increase in maize height due to the biochar (Figure 7). The soils which had the lowest pH initially were those that responded most to the addition of the biochar.
|
|
| Figure 7: Relationship between pH of soils and height of mai |
The greater response to the biochar on the acid soils would appear to be partly due to the highly alkaline nature of the biochar which contained 64% of ash, presumably derived from potassium and calcium salts and silica which are the main mineral elements in the original husks of the rice which was the feedstock used in the gasifier that produced the biochar. Several reports in the literature indicate that crop yield responses to biochar are pH dependent with greater effects in acid soils (Rondon et al 2004; Zwietenoe Lukas Van 2006). Thus, Nguyen Huu Yen Nhi (2008) observed no effects of biochar on maize grown in soils with pH greater than 6.0. By contrast, Rodgríguez et al (2008) observed major increases in growth of maize due to biochar addition in eroded soils with pH less than 4.5. Low pH levels affect soil nutrients by converting them into forms that are not readily available to the crop: in addition, low pH levels increase the solubility of toxic metals such as aluminum resulting in stunted growth of the plant (Nielsen 2005).
Biochar derived from gasification of rice husks contained 64% of ash and 36% of carbon.
Applying it to soils of low pH (<5.0) in a concentration of 5% (=36 tonnes carbon/ha) increased soil pH, and the speed of germination and the height and biomass yield of maize in the soil.
It is suggested that part of the effect of the biochar is to raise soil pH, hence the greater responses in the acid soils.
The mini-project was carried out at Kampong Cham National School of Agriculture Cambodia. I would like to thank the SIDA- SAREC for funding this mini-project a part of the MSc program course through the regional MEKARN project. I would like to express gratitude to Dr Thomas R Preston and Dr Do van Xe for patient guidance and encouragement and making it possible for us to complete the mini-project. I also would like to express my sincere thanks to staff of CelAgrid, Mr. Chhay Ty and staff of NAFRI, Ms Latsamy and Kampong Cham National School of Agriculture staff who provided valuable assistance in helping to analyze the data in the laboratory and preparing the materials for conducting the mini-project. Many thanks to my classmates in the MSc course for their contributions, suggestions and friendships.
.
AOAC 1990 Official methods of analysis. Association of Official Analytical Chemists, Arlington, Virginia, 15th edition, 1298 pp.
Boonchan Chantaprasarn 2003 Measuring fertility of soils by the bio-test method. MEKARN Miniprojects 2003-2005 http://www.mekarn.org/msc2003-05/miniprojects/webpage/cont_mp.htm
Nielsen B 2005 Symptoms Associated with low soil pH in corn http://www.ppdl.purdue.edu/PPDL/weeklypics/7-11-05.html
Chamnanwit Promkot 2001 Study of the use of maize and water spinach in a biotest for evaluation of soil fertility. MSc. Course 2001-2003, Sida-SAREC http://www.mekarn.org/MSc 2001-03/minipro/cham.htm
Davies R 2007 Biochar/Agri-char /Terra Preta: Its potential use for carbon sequestration, improve soil fertility and sustainable (carbon-negative) energy production and poverty reduction. http://www.shimbir.demon.co.uk/biocharrefs.htm
Glaser B, Lehmann J and Zech W 2002 ‘Ameliorating physical and chemical properties of highly weathered soils in the tropics with charcoal –Are view’ Biology and Fertility of Soils 35, 219–230.
Lehmann J and Glaser B 2003 ‘Nutrient availability and leaching in an archaeological Anthrosol and a Ferralsol of the Central Amazon basin: fertilizer, manure and charcoal amendments’, Plant and Soil 249, 343–357.
Lehmann J and Rondon M 2005 ‘Bio-char soil management on highly-weathered soils in the humid tropics’, in N. Uphoff (ed.), Biological Approaches to Sustainable Soil Systems, Boca Raton, CRC Press, in press.
Lehmann J 2007 A handful of carbon. Nature 447 143-144 http://www.css.cornell.edu/faculty/lehmann/publ/Nature%20447,%20143-144,%202007%20Lehmann.pdf
Nguyen Phuc Tien, Ngo Tien Dung Nguyen, Theo Mui Dinh Van Binh and Preston T R 2003 Mulberry (Morus alba) and cassava (Manihot esculenta) on sloping land in Bavi area. In: Proceedings of Final Improving biomass yield and soil fertility by associations of Flemingia (Flemingia macrophylla) with National Seminar-Workshop on http://www.mekarn.org/sarec03/tienbavi.htm
Nguyen Huu Yen Nhi 2008 Effect of bio-char on the growth of maize (Zea mays) in two types of soil . Miniproject, Mekarn MSc 2008-10. http://mekarn.org/msc2008-10/miniprojects/minpro/nhi01.htm
Rodriguez Lylian, Salazar P and Preston 2008 Effect of biochar on growth of maize in acid soils in Colombia. Livestock Research for Rural Development (in press).
Rondon M, Ramirez A and Hurtado M 2004 Charcoal
additions to high fertility ditches enhance yields and quality of cash crops in
Andean hillsides of Colombia. CIATAnnual Report 2004, Cali,
Colombia (2004).
Undersander D, Mertens D R and Lewis B A 1993 Forage analysis procedures. National Forage Testing Association. Omaha pp 154.
Zwietenoe Lukas Van 2006 Magic biochar Recycles, fertilizes and sequesters. http://www.dpi.nsw.gov.au/archive/agriculture-today-stories/september-2006/magic-biochar