Effects of different substrates and levels of seeding on reproductive rate of earthworms
Chu Manh Thang
National Institute of Animal Husbandry, Hanoi, Vietnam
Thang@mekarn.org
Abstract
A 2x5 factorial trial with 2 replications was conducted in An Giang University from 4 to 31 August 2003 to evaluate effects of different substrates and levels of seeding on reproductive rate of earthworms (Eisenia foetida). Five levels of earth worm seeding were used: 0.5, 1, 1.5, 2 and 2.5% with two substrates: cattle manure (OM of 86.1% in DM and N% in DM of 2.41) and poultry manure (OM of 68.4% and N of 2.52%). 3.1 kg of cattle manure and 2.0 kg of chicken manure (from laying birds in cages) were put in plastic baskets (area 0.09 m2) lined with netting . The design was a completely random design (CRD).
There was a significant effect (P= 0.021) of the kind of
manure in the pH value at the end of experiment. With cattle manure the pH decreased
during the experiments at all levels
of earth worm seeding, but there was no evident change seen in
the poultry manure.
It is concluded that poultry manure in the fresh state is not a suitable substrate for earth worm production. It is recommended that poultry manure from layer cages should be processed before introducing the earth worms.
Keywords: Cattle manure, compost, red earth worms, seeding
rate, poultry manure
Introduction
One way of improving the animal production without negative
effects on the environment and of increasing the efficiency of
resources utilization is by integrating all the processes in the
system, in the context of the sustainable use of those resources
(Beteta 1996; Preston 2000).
Recently, the use of the California Red worm (Eisenia foetida) as an agent for recycling live stock manure has received increasing attention (Preston and Rodríguez 2002). Eisenia fetida which is nicknamed "red wigglers" (the correct pronunciation is eye-SEN-ee-uh FE-ti-duh) is durable, resilient and well suited for the rigors of harvesting and shipping. Eisenia fetida can tolerate a wide range of temperatures, from 90 degrees Fahrenheit to nearly freezing. Eisenia fetida is exceptionally prolific due to consistent production of cocoons with outstanding hatching rates of young which reach sexual maturity in as few as seven weeks. Worms reproduce sexually, but they have only one gender, and can all produce both sperm and eggs. The sexual organs of adults are in their bands. Eisenia fetida has proved many times to have high demand and value because of its reproductive rate, the speed in which it can compost large amounts of material, the wide range of temperature tolerance and pH levels, and approximately 50% to 70% of what it consumes becomes castings (Earth worm FAQ).
The products of this process are the worm castings ("worm compost") and the worms themselves. The worm compost derived from manure is superior to the original manure as a fertiliser (Nguyen Quang Suc et al 2000). In this way, waste material is converted to a rich organic fertilizer by the use of mass concentrations of worms and returning essential plant and animal material back to the soil.
The worms themselves can be fed to chickens as a high quality protein supplement (Rodríguez et al 1995). Ravindran and Blair (1993) give an in-depth review of animal protein sources for poultry in which they include the earthworm meals.
Therefore, the earthworm is very important in improving the
quality of soil by recycling decaying material; it also provides
food for other animals. The cultivation of earth worm using local
resources such as livestock manure would seem to be a potential
intervention for improvement of the quality of living standards in
smallholders in the countryside.
Objectives:
The objectives of the mini-project to be described in this study were to determine the effect of different substrates (cow and poultry manure) and the initial proportion of worms in the substrate on the rate of growth and reproduction of earth worms and rate of breakdown of the substrate.
Materials and methods
Location
The experiment was conducted in An Giang University, in Longxuyen city.
Experimental design
The treatments were five seeding rates of adult California Red
worms (Eisenia foetida) and two sources of substrate (manure
derived from cattle and poultry). The proportions of earth worms
are 0.5, 1.0, 1.5, 2.0 and 2.5% of earth worms in the fresh manure
(Table 1).
The experimental layout is a completely randomized design (CRD) with two replications. The experiment lasted for 28 days (from August 4, 2003 to August 31, 2003)
|
Table 1: Experimental layout |
||||||||||
|
Treatments |
Cattle |
Poultry |
||||||||
|
0.5% |
1.0% |
1.5% |
2.0% |
2.5% |
0.5% |
1.0% |
1.5% |
2.0% |
2.5% |
|
|
Earth worms, g |
15.6 |
31.2 |
46.8 |
62.4 |
78 |
10 |
20 |
30 |
40 |
50 |
|
Manure, kg |
3.1 |
3.1 |
3.1 |
3.1 |
3.1 |
2 |
2 |
2 |
2 |
2 |
|
Compost, kg |
0.5 |
0.5 |
0.5 |
0.5 |
0.5 |
0.5 |
0.5 |
0.5 |
0.5 |
0.5 |
|
Note: The amount of initial manure is equal in cattle and poultry manure on DM basis (0.5 kg) |
||||||||||
Housing and management
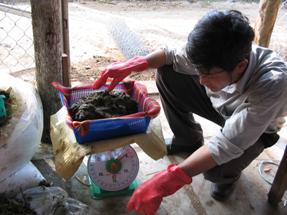
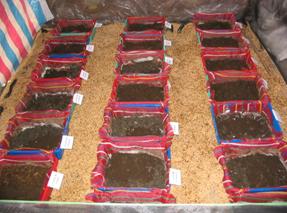
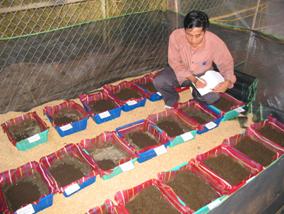
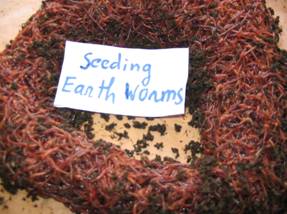
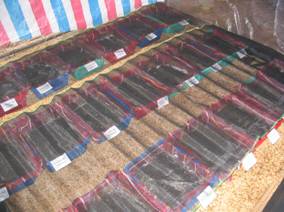
The earth worm seeding stock (Photo1) was mixed with the fresh cattle manure and poultry manure and placed in plastic baskets lined with nylon netting and located in a house roofed with dry grass. Dark netting mesh for keeping out the insects covered the top of each basket and created a dark environment above the substrate (Photo 2). A layer of rice husks was put in the bottom of the baskets to facilitate drainage. The baskets had an area of 0.09 m2 (35*25 cm) and were placed at random following the CRD process.
 |
 |
|
Photo 1: The earth worms used in the experiment |
Photo 2: The baskets covered with plastic mesh in the house |
Measurements
The DM, OM, nitrogen and pH of the sample of original manure and substrate at
the beginning and the end were determined. Every week
during the experiment, sample of the substrate were taken for analysis of
DM and pH to adjust to the optimal humidity for earth worms. At the end of the experiment, the contents of each basket were
weighed and separated into earth worms and residual substrate. The worm eggs were counted in samples of the
residual substrate
Statistical analysis
The data were analysed using the
General Linear Model option of the ANOVA program of the Minitab Software (Version
13). The model was:
Yij = µ + ai + bj + (ab)ij + eij
Y = Response parameter
µ = Overall mean.
a = Effect of seeding rate i
b = Effect of kind of substrate j
e = Error
ab = Interaction between seeding rate and substrate
Results and discussion
Earth worm husbandry, as with any livestock, requires management to ensure adequate reproduction, growth, and health (Beetz 2001).The initial feeding material is important for raising earth worms; the worms thrive in certain optimal conditions, and it is necessary to control moisture, temperature, food supply, pH and worm density (Lieberman 2001). Cattle manure was lower in DM content as compared to poultry manure (Table 2), where the reversal was true for the organic matter content. The nitrogen content was similar in the two studied treatments.
|
Table 2: Nutrient composition of cattle and poultry manure used in the experiment |
|||
|
Treatments |
Dry matter (%) |
Organic matter |
Nitrogen |
|
Cattle manure |
16.0 |
86.1 |
2.41 |
|
Poultry manure |
25.0 |
68.4 |
2.52 |
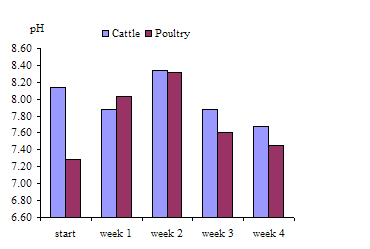
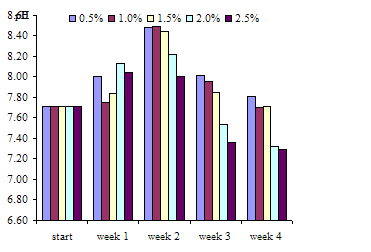
Changes in pH values in cattle and poultry manure are listed in table 3 and figure 1a, 1b.
At the beginning of the experiment cattle manure had an average pH of 8.14 (Table 3; Figures 1a and 1b), while poultry manure had a somewhat lower value (pH= 7.29). There was a significant (P<0.05) influence of the type of manure on pH values at the end of the study. When cattle manure was used, a decrease in pH was evident in all treatments after 28 days of experiment. This same effect was observed in the poultry manure, but only with levels of 2 and 2.5 % of seeding rate. In the cattle manure, the decrease in pH was greater at the highest seedling rates(Figure 1b).
|
Table 3: The change of pH of sustrate at beginning and at the end (after 28 days of experiment) according to seeding rate and kind of manure |
|||||||||||
|
Treatments |
0.5 |
1.0 |
1.5 |
2.0 |
2.5 |
SEM |
Prob. |
||||
|
Cattle |
|
|
|
|
|
|
|
||||
|
Begin |
8.14 |
8.14 |
8.14 |
8.14 |
8.14 |
- |
- |
||||
|
End |
7.70 |
7.54 |
7.51 |
7.80 |
7.86 |
0.13 |
0.001 |
||||
|
Poultry |
|
|
|
|
|
|
|
||||
|
Begin |
7.29 |
7.29 |
7.29 |
7.29 |
7.29 |
- |
- |
||||
|
End |
7.92 |
7.86 |
7.92 |
6.85 |
6.72 |
0.13 |
0.001 |
||||
|
|
Factorial effect analysis |
||||||||||
|
Kind of manure |
* |
||||||||||
|
Level of EW |
*** |
||||||||||
|
:* P<0.05;*** P<0.001
|
|||||||||||
Earth worm growth
There was a significant effect (P<0.001) of kind of manure on yield of earth worms, as in the poultry manure the earth worms did not survive beyond 14 days at all seeding levels (Table 4). The earth worm population increased on all the seedling levels in the cattle manure but there was no apparent relationship between the seeding rate and the absolute increase in the earth worm population or the increase, expressed as yield of earth worms per kg fresh manure used. In a trial comparing different substrates (SanThy 2001), it was found that it was not good to apply the earth worm culture in fresh manure when this came from pigs or poultry. Even when soil was mixed with the manure the growth of the earth worms was very little compared with using cattle manure. It was a recommendation from the Vermicomposting newspaper (Vermicomposting Training Manual) that the feeding materials should be mixed with the bedding, watered and allowed to ferment for about two to three weeks before introducing to the earth worms.
The net yield of earth worm per 100 kg fresh cattle manure was in the range of 0.5 to 0.7 kg (Table 4). This is similar to the 0.55 to 0.72% yield reported by SanThy (2001) using cow manure and an incubation period of 21 days. Higher values were recorded by Nop Sophary et al (2002), Rodriguez et al (1995) and Nguyen Quang Suc et al (2000) where the yield range was from 0.9 to 2.6. However, in these studies the incubation period was 3 months. According to Nop Sophary et al (2002), the time to reach maximum earth worm concentrations in the substrate was at the end of 2 months
|
Table 4: The yield of earth worms after 28 days of
experiment , according to seeding rate and kind of
manure |
|||||||
|
Treatments |
0.5 |
1.0 |
1.5 |
2.0 |
2.5 |
SEM |
Prob. |
|
Cattle |
|
|
|
|
|
|
|
|
Begin (g) |
15.6 |
31.2 |
46.8 |
62.8 |
78 |
- |
- |
|
End (g) |
32.5 |
37.0 |
69.5 |
82.0 |
96.5 |
2.09 |
0.001 |
|
Increase |
16.9 |
5.8 |
22.7 |
19.2 |
18.5 |
- |
- |
|
Yield of earth worms (g/100g fresh manure) |
0.54 |
0.19 |
0.73 |
0.62 |
0.59 |
0.67 |
0.001 |
|
Poultry |
|
|
|
|
|
|
|
|
Begin (g) |
10 |
20 |
30 |
40 |
50 |
|
|
|
End (g) |
- |
- |
- |
- |
- |
|
|
|
Increase |
- |
- |
- |
- |
- |
|
|
|
Yield of earth worms (g/100g fresh manure) |
- |
- |
- |
- |
- |
|
|
|
|
Factorial effects analysis |
||||||
|
Kind of manure |
*** |
||||||
|
Level of EW |
*** |
||||||
|
*** P<0.001 |
|||||||
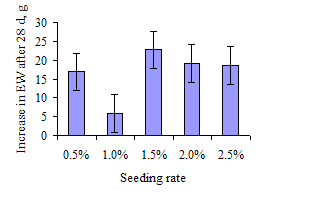
The highest earth worm yield was observed at the seeding rate of 1.5% (Figures 2 and 3). However, there was no further increase of the yield value at higher seeding levels (2.0 and 2.5%), compared to the lowest level of seeding rate (0.5%). It is probable that there was not enough substrate for the higher concentration of earth worms at the 2.0 and 2.5% level.
 |
 |
| Figure 3: Earth worm yield (g/kg of cattle manure) according to seeding rate |
Earth worms are sensitive to pH, and a range of between 6.8 and 7.2 is best for commercial earth worm production (Beetz 2001). However, in this study there was no correlation between the pH value of the substrate and the survival of the earth worms because pH was similar on both types of manure but no earth worms survived in the poultry manure. This indicates that in this study the pH of the substrate was not affecting the survival rate of the earth worms in the poultry manure.
|
|
|
|
Photo 3: A white circle appeared at the
edges of poultry
manure substrate at the 2nd weeks of experiment |
Photo 4:
The white circle appeared in all level of worm seeding in the poultry
manure |
Earth worm reproduction
There were no eggs in any of the treatments after 28 days, even with the highest level of earth worms in the substrate of cattle manure. The interpretation of these results is that the rate of reproduction was not affected by the initial level of earth worm seeding in the first month. Nop Sophary et al (2002) indicated that the amount of initial population was important during the first month when earth worm numbers were very low, and it was only increasing at the end of the second month. In the study of Nguyen Quang Suc et al (2000), the rate of reproduction of the worms was slow in the first two months, reaching a maximum after three months.
The rate of breakdown of subtrate
The yield of residual "worm compost" (after 28 days of transformation of manure) and the degree of breakdown of the substrates (expressed as amount of DM lost /DM of initial manure) is shown in Table 5 and Figure 5. The nutrient composition of earth worms at the end of the experiment is in Table 6.
|
Table 5: The yield of residue and the breakdown of
sustrates rate with manure used (fresh manure) after 28 days of
experiment according to seeding rate and kind of manure
|
||||||||
|
Treatments |
0.5 |
1.0 |
1.5 |
2.0 |
2.5 |
SEM |
Prob. |
|
|
Cattle |
|
|
|
|
|
|
|
|
|
Yield of residue (% on fresh basis) |
65.3 |
62.1 |
63.0 |
62.0 |
65.0 |
2.53 |
0.56 |
|
|
Degree of breakdown of substrate DM |
0.21 |
0.21 |
0.26 |
0.27 |
0.26 |
0.05 |
0.07 |
|
|
Poultry |
|
|
|
|
|
|
|
|
|
Yield of residue (% on fresh basis) |
59.0 |
58.2 |
51.0 |
54.4 |
59.8 |
2.53 |
0.56 |
|
|
Degree of breakdown of substrate DM |
0.32 |
0.20 |
0.29 |
0.09 |
0.15 |
0.05 |
0.07 |
|
|
|
Factorial effects analysis |
|||||||
|
Yield of residue |
Breakdown of substrate rate |
|||||||
|
Kind of manure |
** |
|
||||||
|
Level of EW |
|
|
||||||
|
** P< 0.01 |
||||||||
|
Table 6: Composition of the earth worms after 28 days of
experiment |
|||
|
|
Dry matter |
Organic matter |
Nitrogen |
|
Earth worms |
20.5 |
86.1 |
10.6 |
There were significant effects (P=0.002) for yield of worm compost between the two kinds of manure, with a much lower value for the poultry manure. This was to be expected as the period of earth worm activity in the poultry manure ended at the end of the second week.
The yield of worm compost was around 62 to 65 kg from 100 kg of fresh cattle manure, and was not affected by the seeding rate (P>0.05). This is lower than was reported by Nop Sophary et al (2002) (a mean value of 67 after 92 days of experiment) but higher than data from Beteta (1996) and Rodriguez et al (1995) of 49 to 57 kg from 100 kg of fresh manure.
One of the benefits from earth worm culture is the production of a valuable protein source ( Lieberman 2002). In this study the nitrogen content was 10.6, equal of a crude protein content of 66% in dry basis. This value was lower than the result reported by Santhy (2001) of an average value of 79.6%. These differences may be due to the difference between the origin of the earth worms as Santhy (2002) used earth worms whose origin was Cambodia and Colombia.
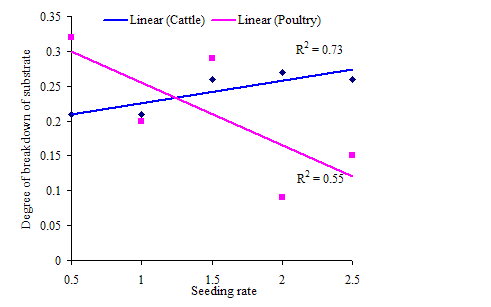
Figure 5: The trend line of degree of breakdown substrate
in cattle and poultry manure
according to the seeding rate after 28 days of experiment
There were highly significant (P<0.001) differences in the percent of dry
matter (DM) and of organic matter (OM) in compost from the cattle manure as
compared to that from the poultry manure. These values were around 20 to 22 and 55
to 58% in cattle manure, respectively. There were also no change between levels of earthworm seeding.
These data are similar to those reported by Nop Sophary et al
(2002) of 24 to 25% DM and 59 to 61% OM in DM, after 1 month of study.
|
Table 7: Composition of the residue after 28 days of experiment, according to seeding rate |
|||||||
|
Treatments |
0.5 |
1.0 |
1.5 |
2.0 |
2.5 |
SEM |
Prob. |
|
Cattle |
|
|
|
|
|
|
|
|
Dry matter (%) |
21.2 |
22.3 |
20.6 |
20.6 |
20.1 |
1.79 |
0.03 |
|
Organic matter (% in DM) |
55.8 |
55.1 |
56.9 |
56.4 |
57.9 |
1.36 |
0.74 |
|
Nitrogen (% in DM) |
1.59 |
2.40 |
2.80 |
4.27 |
3.67 |
|
|
|
Poultry |
|
|
|
|
|
|
|
|
Dry matter (%) |
28.9 |
35.0 |
35.5 |
42.7 |
36.2 |
1.79 |
0.03 |
|
Organic matter (% in DM) |
44.5 |
44.4 |
42.8 |
43.7 |
45.2 |
1.36 |
0.74 |
|
Nitrogen (% in DM) |
1.84 |
4.34 |
1.64 |
2.03 |
1.99 |
|
|
|
|
Factorial effects analysis |
||||||
|
DM (%) |
OM (% in DM) |
Nitrogen (% in DM) |
|||||
|
Kind of manure |
*** |
*** |
Ns |
||||
|
Level of EW |
* |
Ns |
Ns |
||||
|
*** P<0.001; * P<0.05 |
|||||||
Conclusions
From this study, the following conclusions can be drawn.
- The OM content was higher in cattle manure as compare to chicken manure, but there was no difference of nitrogen value between these manures.
- Poultry manure was not suitable for earth worm production in the fresh state. It should be processed before introducing the earth worms
- In the cattle manure, the yield of earth worms was in the range 0.5 to 0.7 kg per 100 kg fresh basis, the highest value was observed at 1.5% seeding rate.
- There were no worm eggs after 28 days of experiment.
- The yield of worm compost was around 62 to 65 kg from 100 kg of fresh cattle manure, and was not affected by the seeding rate.
References
Beetz Alice 2001 Baitworm production; ATTRA. http://www.attra.ncat.org/
Earth worm FAQ (reprinted from Green Hut). The compost resource http://www.oldgrowth.org/compost/index.html
Earth worm Info. http://earth.worm.info/worm
Fraser P 2002 The effect of soil management practices on Earthworm population. Fertilisers. http://www.crop.cri.nz/index.html
Lieberman S 2001 Worms, beautiful worms !!.
International Real Estate Digest.
http://
Lieberman S 2003 Realty Times-Real Estate News and Advice. http://realtytimes.com.
Nguyen Quang Suc, Le Thi Ha and Dinh Van Binh 2000 Manure from rabbits, goats, cattle and buffaloes as substrate for earthworm. Workshop- seminar "Making better use of local feed resources" (Editor: T R Preston, B Ogle and Luu
Trong Hieu) SAREC-UAF, January, 2000, Ho Chi Minh city, Vietnam
Nop Sophary, T R Preston and Khieu Borin 2002 Processing cattle manure with California red worms (Eisenia foetida); effect of seeding rate (rate of worm to subtrates) on the conversion of manure to end_products. http://utafoundation.org/utacambod/msc99thes/pharypaper2.htm
Preston T R 2000 Livestock Production from Local Resources in an Integrated Farming System; a Sustainable Alternative for the Benefit of Small Scale Farmers and the Enviroment.Workshop- seminar "Making better use of local feed resources" (Editor: T R Preston, B Ogle and Luu trong Hieu) SAREC-UAF, January, 2000, Ho Chi Minh city, Vietnam
Ocampo A 1996 The African oil palm in integrated farming systems in Colombia: new developments. Eight Paper, FAO Electronic Conference on Livestock Feed Resources within Integrated Farming Systems. http://www.fao.org/waicent/FaoInfo/Agricult/AGA/AGAP/FRG/
Ravindran V and Blair R 1993 Feed Resources for poultry production in Asia and the Pacific. !!!. Animal Protein sources. World's Poultry Science Journal, Vol. 49, November 1993. 219 - 235
SanThy 2001 Culturing earthworm in different substrates. Mini-projects; MSc cources - SAREC 2001-2003.
Vermicomposting Training Manual 2002 Vermicomposts. http://www.village.uct.ac.za/sustainable
livelihoods/default.htm
Wash and wear Earth worming 2001 http://www.earthmuse.com/forearth/earthworm.htm
Appendix
|
|
|
Photo 5: Weighing the initial manure
|
Photo 6: Weighing the earth
worm seeding
|
|
|
|
Picture 7: Arrangement of baskets in the house
|
Picture 8: Collecting of data every week
|
