Nutritional evaluation of plant species using the
water extraction technique
Miech Phalla
University of Tropical Agriculture, Cambodia
phalla@utafoundation.org
phalla@mekarn.org
Abstract
Thirteen samples of leaves of various tropical plant species available around An Giang University, Vietnam, were selected for determining dry matter and N content and water extractable DM and N as indicators of nutritive value. The leaf samples were dried by micro-wave radiation, ground in a coffee grinder and washed for 90 minutes in a semi-automatic washing machine.
The range of DM content was from 4.6 to 41.9%, and for N in DM from 1.7 to 5.8%. Water extractable DM ranged from 15.1 to 35.5% and water extractable N from 19.9 to 58.3%. The two water plants with high levels of crude protein in the leaf (Ipomoea and duckweed) had the highest amount of water extractable DM. Levels of water-extractable N were also high for these species. The plants with lowest values for water-extractable DM and N were bamboo, banana and Muntingia. There appeared to be a negative relationship between the DM content of the leaves and the proportion of the water-extractable N.
It is concluded that water extraction is a simple, low cost, and effective technique to indicate the nutritional value for monogastric animals of leaves from trees and water plants.
Key words: Dry matter, nitrogen, nutritive value, plants, water extraction
Introduction
There are many kinds of plant species that are used for animal
feed, derived from local resources but research has concentrated on
very few of these (Rosales and Gill 1997). These authors emphasised the need to make greater use of the diversity of fodder
tree species as providers of animal forage. More than 200 species
of trees fix N and are reported to be useful as fodder species
(Brewbaker 1986). The use of protein-rich feeds like
leaves from trees can improve the nutritive value of low quality crop
residues such as rice straw (Ho Quang Do et al 2001; Mom Seng et al 2001).
The technique of measuring washing losses to estimate the nutrient values of feeds has been proposed for both ruminants (Huntington and Givens 1997) and non-ruminants (Hyslop et al 1999). The method was further developed by Ly and Preston (1997) so as to standardise the procedure, and it was shown that there was a good relationship between this procedure and the conventional in vitro methods based on gas production and pesin-pancreatin digestion (Ly and Preston 2001).
The purpose of the research reported in this paper was to use the water extraction
technique to evaluate a range of plant species available in the
area around An Giang University, and to compare the results with
standard values in the literature.
Materials and methods
Sample collection
Samples of foliage were obtained in the morning (about 9.00am) from a wide range of trees, shrubs, grasses and water plants in the area around An Giang University (Table 1). In the case of the trees, the leaves were from the ends of branches which were about 0.5 m in length. The foliage was separated into leaves, petioles and stems, which were weighed on fresh basis. The names of the plants that were sampled are in materials were shown in Table 1.
| Table 1: Names of the plant species | |||
| N |
Scientific Name |
Common Name |
|
|
English |
Cambodia |
||
|
1 |
Eichhornia crassipes |
Water
hyacinth |
Kam plook |
|
2 |
Lemna minor |
Duckweed |
Chauk |
|
3 |
Ipomoea aquatica |
Red water
spinach |
Traukoun |
|
4 |
Manihot esculenta |
Cassava |
Domloung |
|
5 |
Carica papaya |
Papaya |
Lhong |
|
6 |
Musa spp |
Banana |
Chek |
|
7 |
Hibiscus spp |
Hibiscus |
Phkar
rumyol |
|
8 |
Bambusa spp |
Bamboo |
Reusey |
|
9 |
Muntingia
|
Muntingia |
Traukhob |
|
10 |
Samanea saman |
Saman |
Am
pilteukbaran |
|
11 |
Erithrina indica |
Erithrina |
Rorlous |
|
12 |
Artocarpus heterophyllus |
Jackfruit |
Khnol |
|
13 |
Leucaena leucocephala |
Leucaena |
Kanthomthet |
Procedure
The procedure was described by Ly and Preston (1997). Washing losses (WL) were determined in triplicate samples of each of the leaves and also from the stems for the water spinach. The samples were dried in a fixed temperature oven (60�C) for 24 hours and then in a micro-wave oven to make sure the samples were completely dry to constant weight. They were then ground in a coffee mill. A sample (about 1 g) of the dry ground material was put into weighed nylon bags, size 50 x 150 mm, with a pore size of 45 to 55µ. The bags containing the samples were tied and put into the washing machine with 3 liters of water per bag. Washing took place for 90 minutes with 10 minutes in each cycle. After washing, the bags were dried and weighed and N determined on the dry residue.
Chemical analyses
Samples of each component were analyzed for DM in duplicate by the micro-wave radiation method of Undersander et al (1993). N in the leaves and in the dry residue after washing was determined by the method of AOAC (1990).
Statistical analysis
The data were subjected to analysis of variance (ANOVA) using
the General Linear Model (GLM) option of the MINITAB software
(Release 13.31). Sources of variation were the species and
error.
Results and discussion
Proportions
The proportions of leaves (fresh basis) ranged from 33% for Ipomoea to 67% in the banana plant (Table 2)
|
Table 2. The proportions (% fresh basis) of leaf, petiole and stem in the 13 plant species |
|||
|
|
Leaves |
Petioles |
Stems |
|
Ipomoea |
33.1 |
18.3 |
48.6 |
|
Cassava |
35.0 |
23.9 |
41.1 |
|
Erithrina |
37.0 |
15.9 |
47.1 |
|
Muntingia |
45.6 |
|
54.4 |
|
Water hyacinth |
47.7 |
|
52.3 |
|
Papaya |
51.6 |
|
48.4 |
|
Jackfruit |
56.0 |
|
44.0 |
|
Bamboo |
60.8 |
23.5 |
15.7 |
|
Hibiscus |
61.6 |
7.7 |
30.8 |
|
Leucaena |
63.6 |
21.0 |
15.5 |
|
Saman |
65.5 |
11.0 |
23.5 |
|
Banana |
66.6 |
|
33.4 |
Dry matter and Nitrogen
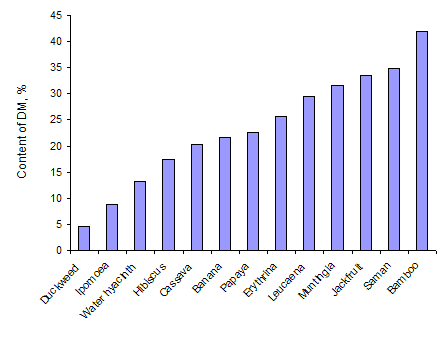
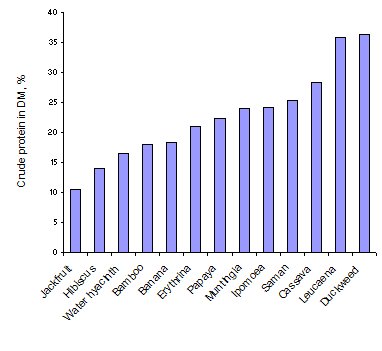
As was to be expected there was a wide range in the dry matter content of the leaves and in the nitrogen (and crude protein) in the leaf dry matter (Table 3 and Figures 1 and 2). Duckweed had the lowest content of dry matter followed by the other water plants (Ipomoea aquatica and water hyacinth). Highest leaf DM content was in Bamboo. The order for N content of the leaves tended to be the opposite of that for DM, but this was not a consistent relationship; N concentrations were highest in duckweed followed by the leucaena leaflets and cassava leaves. Lowest values were in Jackfruit leaves.
|
Table 3: Dry matter and N
content of the leaves |
||
|
|
DM % |
N % |
|
Jackfruit |
33.5 |
1.67 |
|
Hibiscus |
17.4 |
2.23 |
|
Water hyacinth |
13.3 |
2.65 |
|
Bamboo |
41.9 |
2.88 |
|
Banana |
21.6 |
2.93 |
|
Erythrina |
25.6 |
3.36 |
|
Papaya |
22.6 |
3.58 |
|
Muntingia |
31.6 |
3.83 |
| Ipomoea |
8.8 |
3.86 |
|
Saman |
34.8 |
4.06 |
|
Cassava |
20.3 |
4.53 |
|
Leucaena |
29.5 |
5.74 |
|
Duckweed |
4.55 |
5.81 |
 |
 |
| Figure 1: Dry matter content of the leaves of a range of plant species | Figure 2: Crude protein content of the leaves of a range of plant species |
Water extractable DM and N
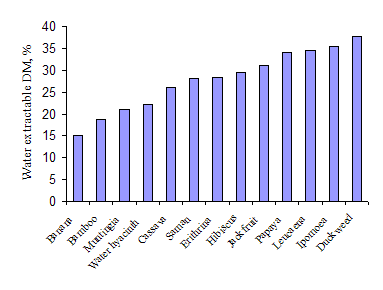
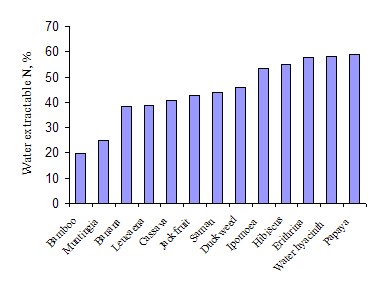
The two water plants with high levels of crude protein in the leaf (Ipomoea and duckweed) had the highest amount of water extractable DM (Table 4 and Figure 3). Levels of water-extractable N were also high for these species (Figure 4). The other water plant (Water hyacinth) was quite different having a low value for water-extractable DM but a high value for water-extractable N. The plants with lowest values for water-extractable DM and N were bamboo, banana and Muntingia.
|
Table 4: Water extractable dry matter (WEDM) and nitrogen (WEN) in the leaves of a range of plant species |
||
|
|
WEDM |
WEN |
|
Banana |
15.1 |
38.3 |
|
Bamboo |
18.7 |
19.9 |
|
Muntingia |
21 |
24.9 |
|
Water hyacinth |
22.1 |
58.3 |
|
Cassava |
26.1 |
40.9 |
|
Saman |
28.2 |
44 |
|
Erithrina |
28.3 |
57.8 |
|
Hibiscus |
29.5 |
54.8 |
|
Jackfruit |
31.2 |
42.7 |
|
Papaya |
34.1 |
59 |
|
Leucaena |
34.5 |
38.9 |
|
Ipomoea |
35.5 |
53.2 |
|
Duckweed |
37.7 |
45.9 |
 |
 |
| Figure 3: Water extractable dry matter in the leaves of a range of plant species | Figure 4: Water extractable nitrogen in the leaves of a range of plant species |
There appeared to be a negative relationship between the DM content of the leaves and the proportion of the water-extractable N (Figure 5).

Figure 5: Relationship between water extractable N and the DM content of the leaves
Values for water-extractable N in this study are compared in Figure 6 with those reported by Ly and Preston (2001). While the trends are similar for both sets of data, and there is good agreement for certain plant species (eg: banana, cassava, Ipomoea and duckweed), there are major discrepancies for others (eg: Leucaena and Jackfruit). The implication is that the method is still not sufficiently well standardised and that the differences between results from different researchers probably reflect differences in the preparation of the samples and the origin of the leaves. In this connection, major differences in the in vivo digestibility of young and old cassava leaves were reported by (Chhayty et al 2003); while Ngo Thuy Bao Tran (2003) encountered consistent differences in the DM, N, and water-extractable DM and N in leaves taken from the top compared with those from the bottom of a range of trees. DM percentage was lower and N and water-extractable DM and N levels were higher in the leaves taken from the top of the trees.

Figure 6: Comparison of the values for
water extractable dry matter with those
reported by Ly and Preston (2001)
Chermiti et al (1996) suggested that washing loss of DM from fibrous feeds represented the detergent soluble substances, or cell contents. Thus water extractable DM and N could be reasonable indicators of the digestibility of fibrous feeds for monogastric animals.
Conclusion
It is concluded that water extraction is a simple, low cost, and effective
technique to indicate the nutritional value for monogastric animals of leaves
from trees and water plants.
Acknowledgments
I wish to thank the MEKARN programme for providing me the opportunity to conduct this mini-project in order to improve and develop my knowledge; and Dr Preston, Dr Ly and MSc Chhay Ty for advice and assistance in interpreting the data.
Reference
AOAC 1990: Official Methods of
Analysis. Association of Official Analytical Chemists. 15th edition (K Helrick
editor) Arlingtonpp 1230
Brewbaker J L 1986: Leguminous trees and shrubs
for Southeast Asiaand the South Pacific. In: Forages
in Southeast Asiaand South Pacific Agriculture (G J
Blair, D A Ivory and T R Evans, editors) Australian Centre for
Internatinal Agricultural Research Proceedings Series No. 12
Camberra p 43-50
Chhay
Ty, Preston
T R and Ly J
2003: The
use of ensiled cassava leaves in diets for growing pigs. 2. The
influence of type of palm oil and cassava leaf maturity on digestibility and N
balance for growing pigs.
Chermiti A, Nefsaoui A, Teller E, Vanbelle M, Ferchichi
H and Rakbani N 1996: Prediction of the voluntary
intake of low quality roughages by sheep from chemical composition
and ruminal degradation characteristics. Animal Science, 62:57-62
Ho Quang Do, VoVan Son, Do Vo Anh Koa and Nguyen Tim Kim
Khang 1999: Urea supplementation of rice straw for
Sindhi x Yellow cattle, sprayed in solution, as a soft cake or hard block.
Livestock Research for Rural Development vol.11 (2)
Huntington J A and Givens D I 1997:
Studies on in situ degradation of feeds in the rumen.1. Effect of species, bag
mobility and incubation sequence on dry matter disappearance.
Animal Feed Science and Technology 64:227-241
Hyslop J J, Stefandottir G J, McLean B M L, Longland A C and
Cuddeford D 1999: In situ incubation sequence and its
effect on degradation of food componentswen measured in the caecum
of ponies. Animal Science 69:147-156
Ly J and Preston T
R 1997: An approach to the
estimation of washing losses in leaves of tropical trees.
Livestock Research for Rural Development 9(3): http://www.cipav.org.co/lrrd/lrrd9/3/ly931.htm
Ly J and Preston T R 2001 In vitro estimates of
nitrogen digestibility for pigs and water-soluble nitrogen are
correlated in tropical forage feeds. Livestock
Research for Rural Development 13(1): http://www.cipav.org.co/lrrd/lrrd13/1/ly131.htm
Mom Seng, Preston T R, Leng R A and ter Meulen U
2001: Effect of a single drench of cooking oil
on the rumen ecosystem and performance of young local "yellow" cattle fed rice
straw and cassava foliage.
Ngo Thuy Bao Tran 2003:
Effect of
age of leaves from forage trees on nutritive value.
Retrieved
September 25, 2003, from MEKARN Mini-projects.
Undersander D, Mertens D Rand Theix N 1993
Forage analysis procedures. National Forage Testing Association.
Omaha pp 154